Feature Overview
Prodia presents a capability system organized around operational reasoning, decision recommendation, result closure, and experience reuse.
1. Capability map
| Capability module | Core capability | Typical business value |
|---|---|---|
| Operational understanding and issue identification | natural-language questions, anomaly recognition, problem focusing, context completion | help the system enter high-value issues faster |
| Reasoning analysis and decision support | process, quality, takt, unit consumption, fault, and predictive maintenance analysis | provide more professional and more action-oriented judgment |
| Result coordination and execution support | cause judgment, priority suggestion, investigation path, execution recommendation | move the system from analysis into action guidance |
| Experience accumulation and continuous improvement | case reuse, rule reuse, adoption records, result recovery | make the system stronger as it is used |
| Integration and governance | connect equipment data, business systems, and knowledge assets under private deployment | lower activation barriers and protect industrial data assets |
2. Three core scenario groups
1. Process optimization
- How can a new specification be stabilized faster
- How should parameters be set, curves adjusted, and recipes selected
- Is the current process window stable, and where should adjustment begin first
2. Operational efficiency optimization
- Why are output, unit consumption, and takt getting worse
- Which part of the loss structure is expanding
- Which operational lever should be optimized first
3. Equipment efficiency optimization
- How should operating fluctuation be interpreted
- What should be checked first after an alarm
- Which devices are degrading, and which maintenance actions should move forward
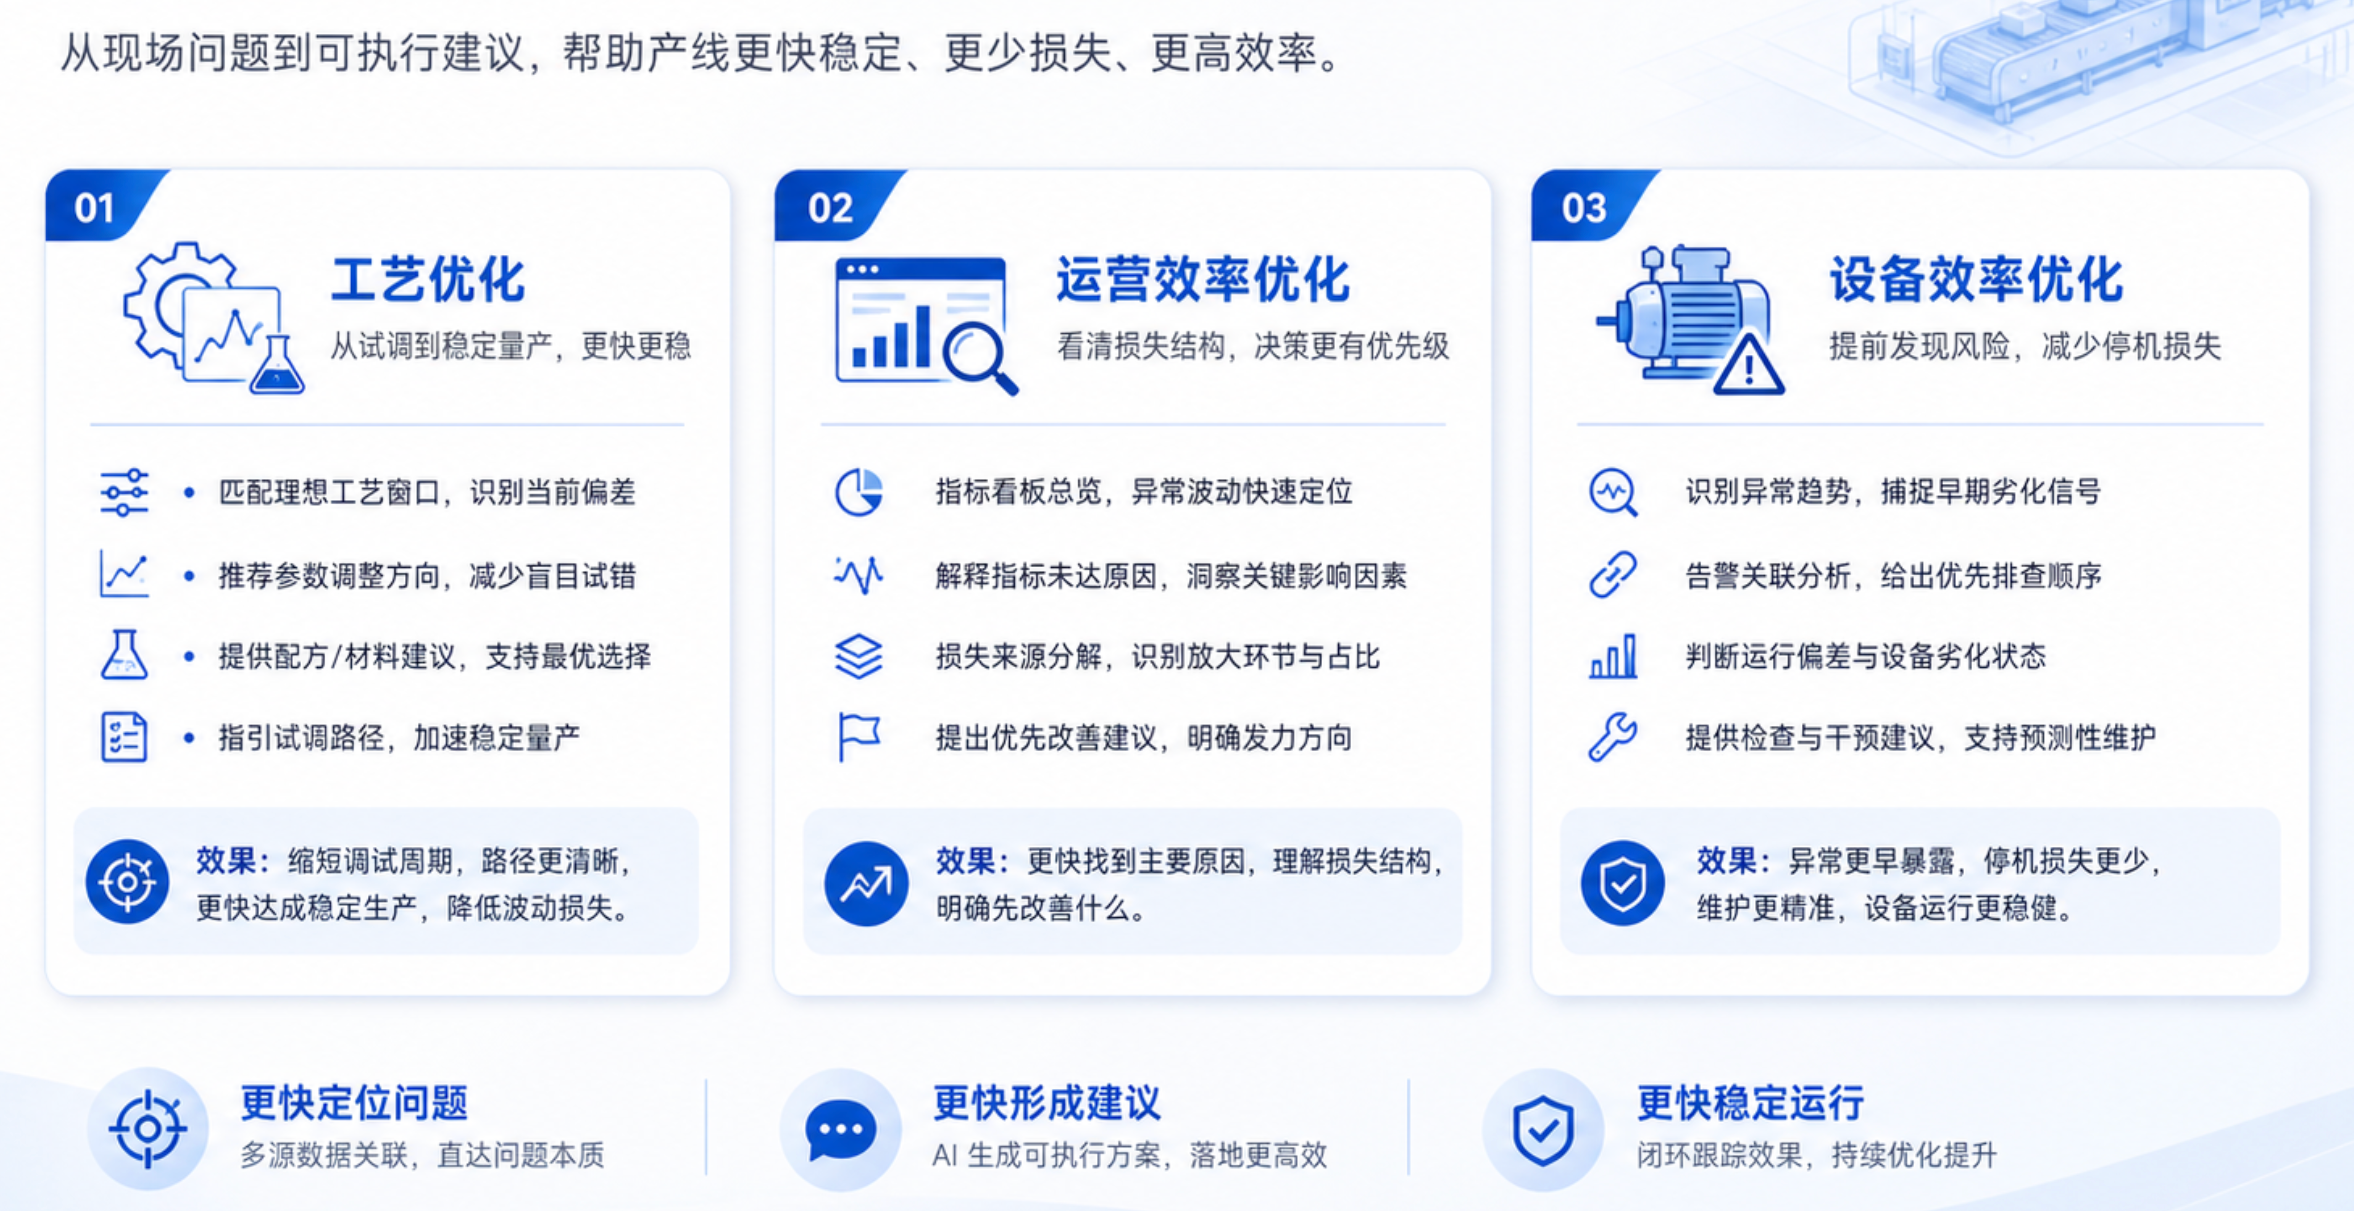
3. From shop-floor issues to actionable recommendations
What customers notice most is a complete path from identifying issues to forming recommendations.
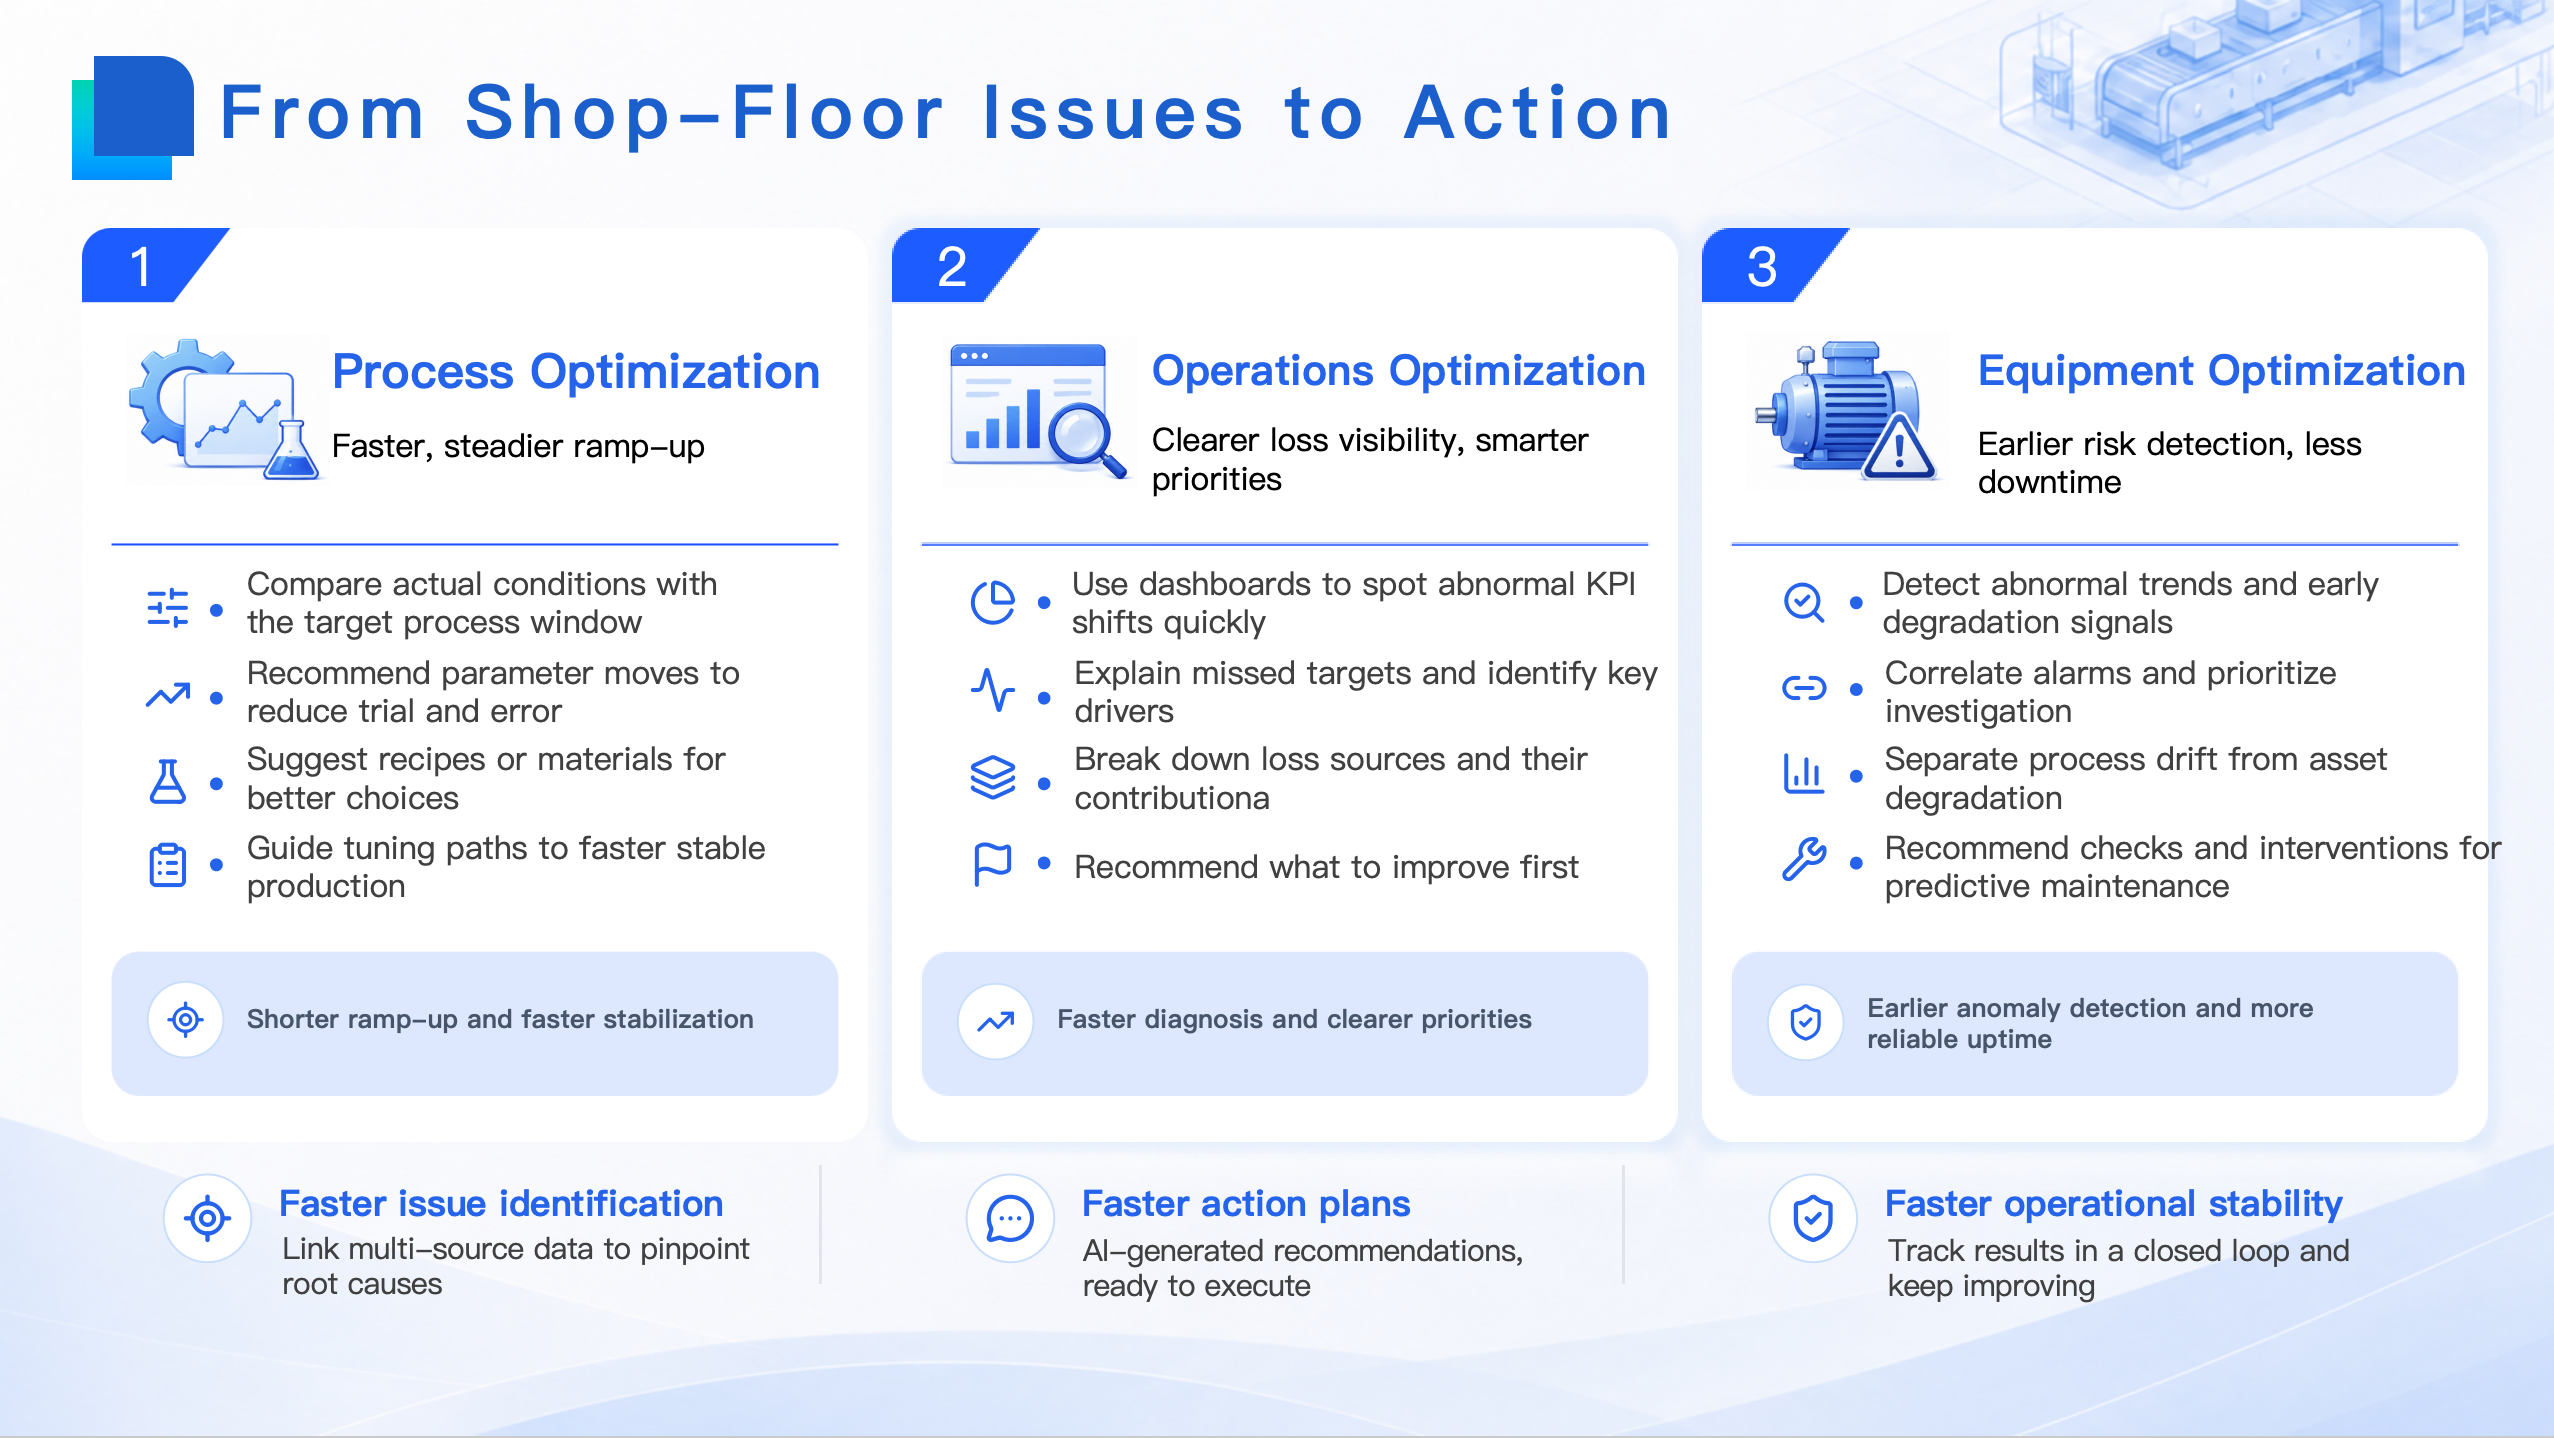
This can be understood as three connected actions:
1. Recognize issues faster
- Which line, process, or equipment deserves priority attention
- What fluctuation affected results most over the last week
- Which bottleneck is continuously dragging down overall performance
2. Form judgment faster
- What is the main factor behind the yield decline
- Which parameter changes are affecting process stability
- Which fault pattern is increasing downtime risk
3. Act faster
- What should be checked first right now
- Which parameters or objects deserve immediate attention
- What adjustment or maintenance action is recommended next
4. How the product capabilities are used
| Scenario | User action | System output |
|---|---|---|
| Process optimization | analyze specification, curve, recipe, and parameter performance | process-window judgment, parameter guidance, optimization direction |
| Operational efficiency optimization | ask why output, unit consumption, or takt changed | main-cause identification, loss decomposition, optimization priorities |
| Equipment efficiency optimization | analyze alarms, states, operating deviation, and risk trends | risk recognition, linkage analysis, inspection and intervention guidance |
| Experience reuse | look for a precedent in a similar issue | cases, rules, and standard handling approaches |
5. A practical way to understand the capability structure
You can read the capability structure in this order:
- Start with operational understanding: the system first understands the actual problem and context
- Then reasoning analysis: it brings data, rules, knowledge, and cases into one reasoning path
- Then decision output: it turns conclusions into recommendations closer to operational action
- Finally closed-loop improvement: it records adoption and results so future recommendations improve