Build Your Project
Use this page to build a first working project.
Follow this path:
- create a project
- define tags
- verify tag values
- build a view
- bind tags to components
- run and verify
Before You Start
Before working through this page, make sure:
- Editor is installed and opens normally
- you have read Core Concepts
- you have one of these inputs:
- a real device and basic communication information
- a tag list from a customer or project spec
- no device at all, starting with internal tags or, if needed, an external channel with Static Simulation
What You Will Build
By the end of this page, you will have:
- one project
- one tag source
- one tag group
- three starter tags
- one monitoring view
- one running result you can verify
Recommended Day-1 Strategy
Choose the branch that matches your situation:
- I have a real device: use an external channel and real tags
- I do not have hardware yet and want the simplest path: start with internal tags and finish the rest of the workflow anyway
- I do not have hardware yet but want to keep PLC-style tags and channel structure: create an external channel and enable Static Simulation
- I only want to understand the product first: complete the First Launch and Workspace Tour before coming back here
Step 1: Create and Open a Project
In the Project Manager, create a blank project.
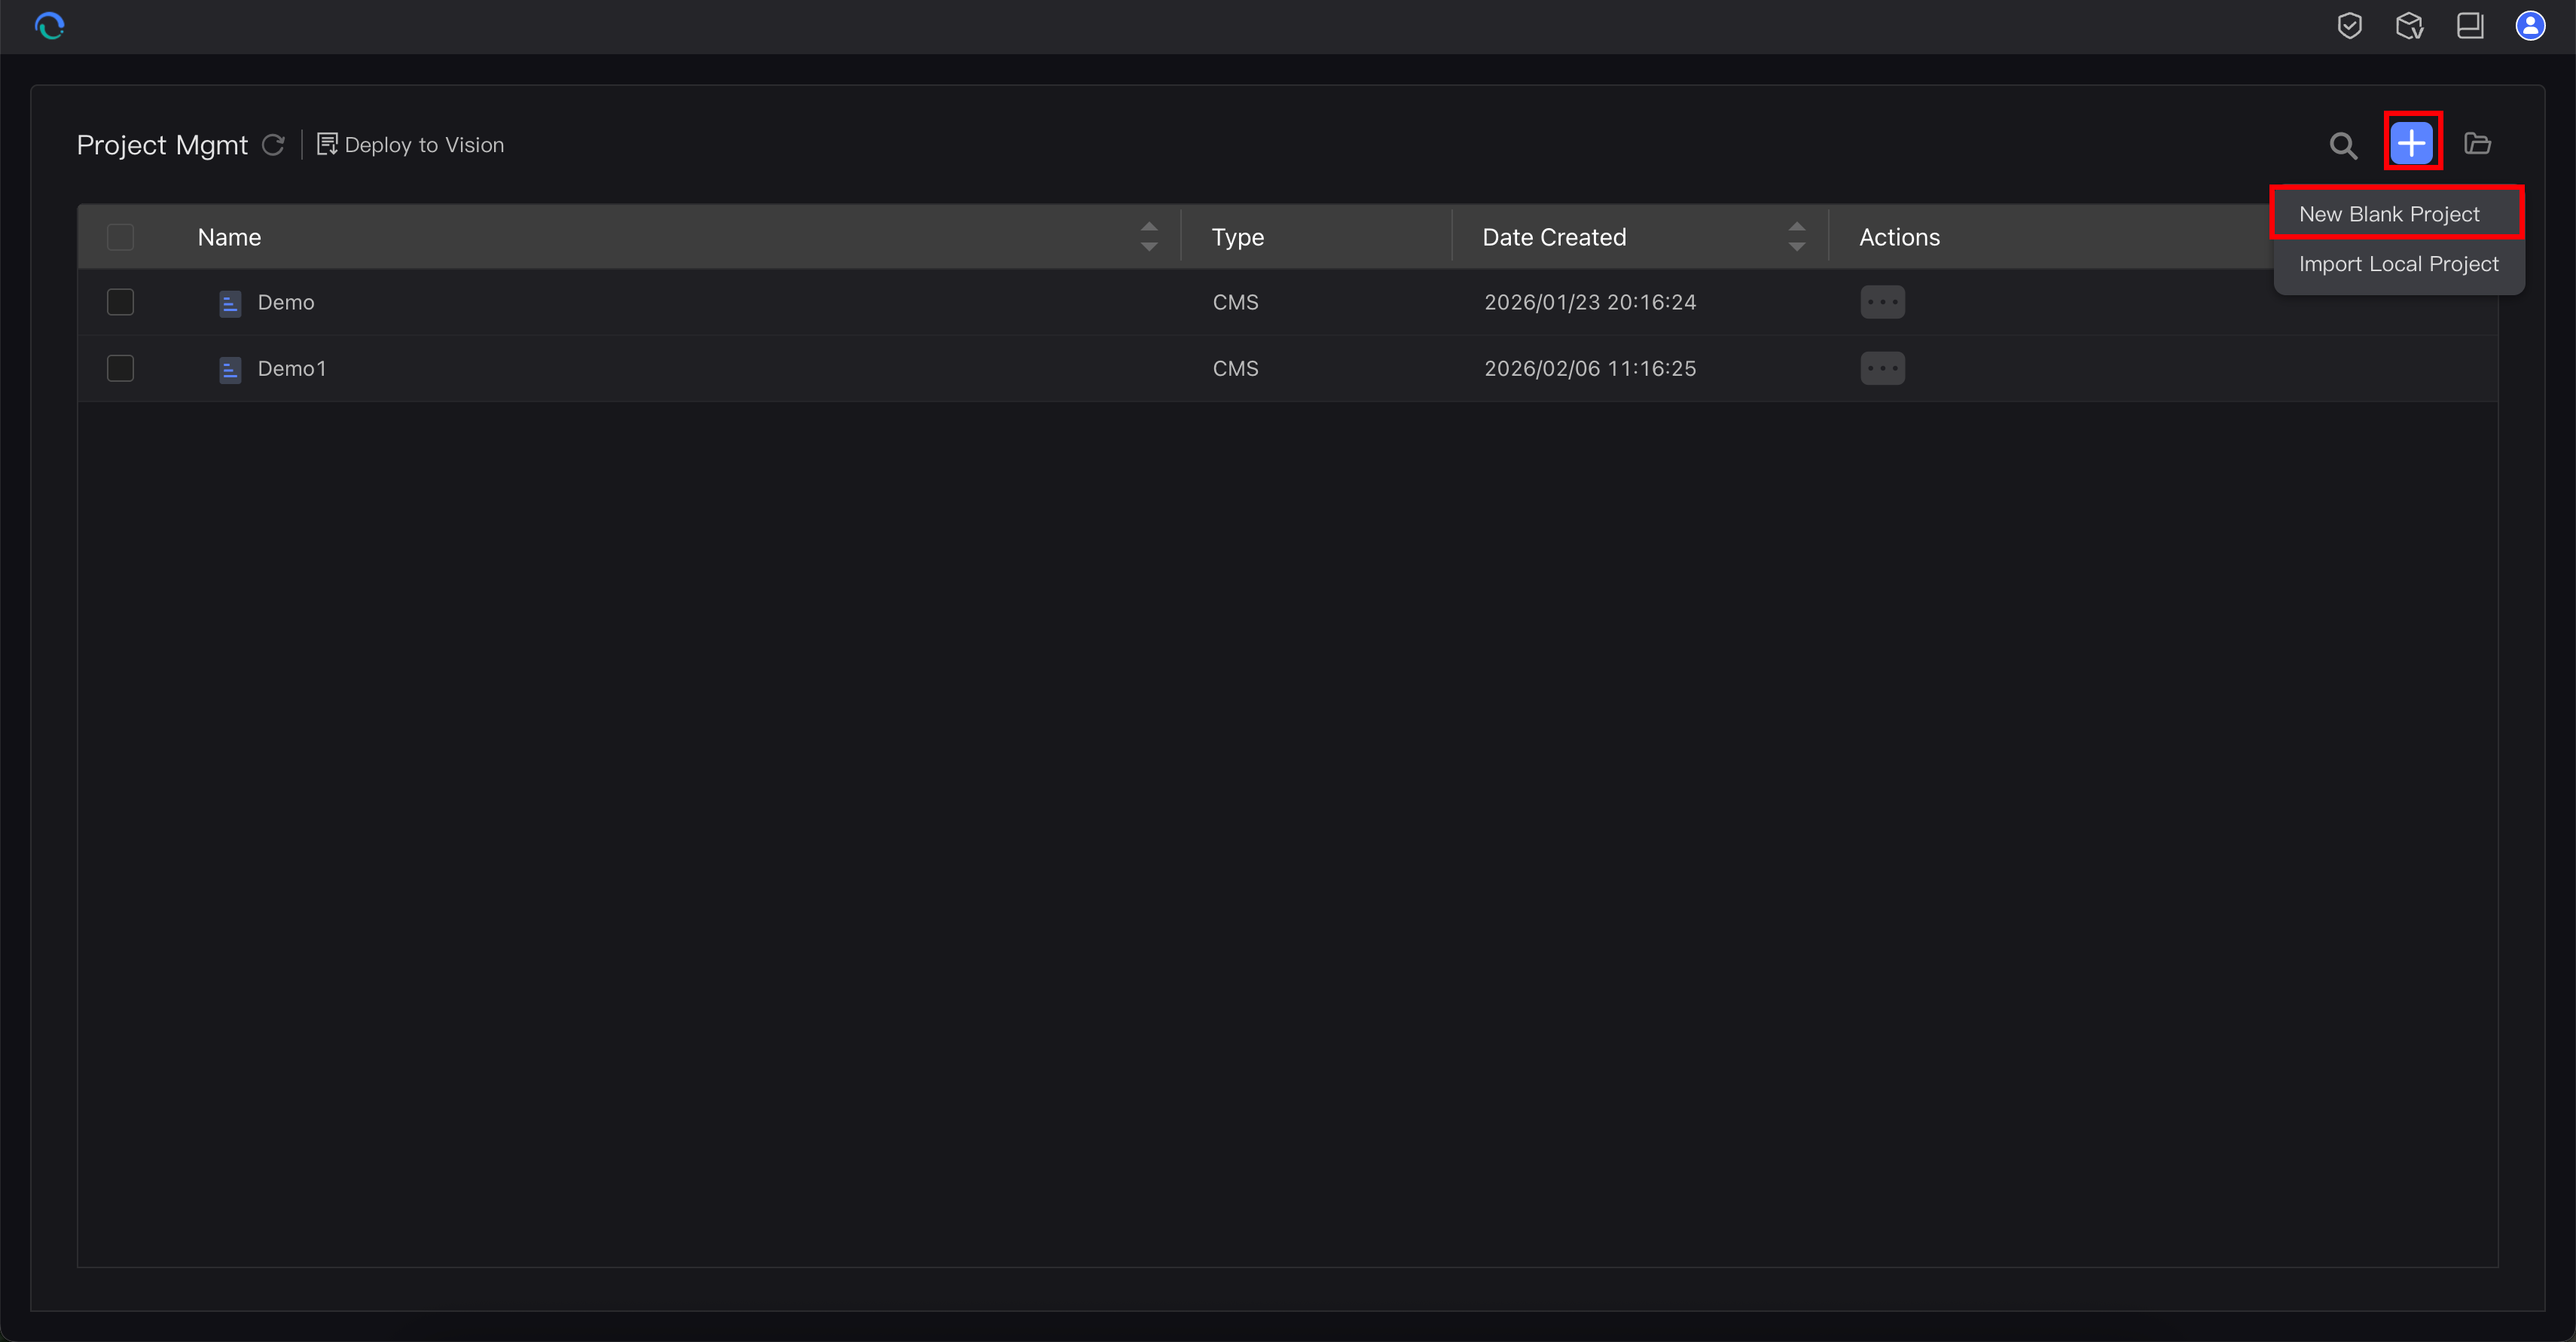
Do this:
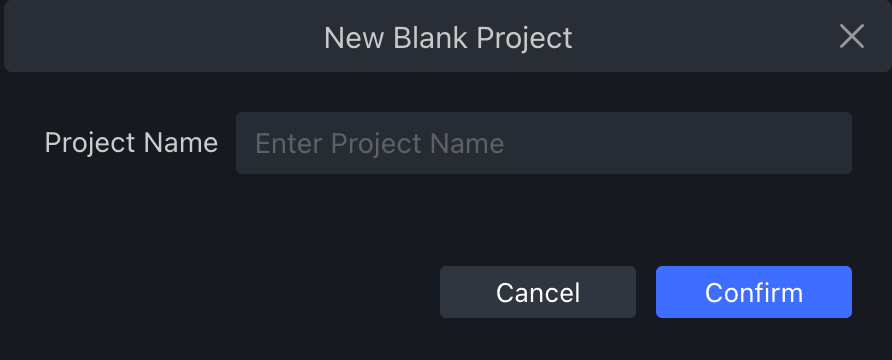
- click the New Blank Project action
- enter a clear project name, such as
BoilerStationDemo,PackingLine01, orPumpSkidTrial - confirm the dialog
Open the project in the editor workspace.
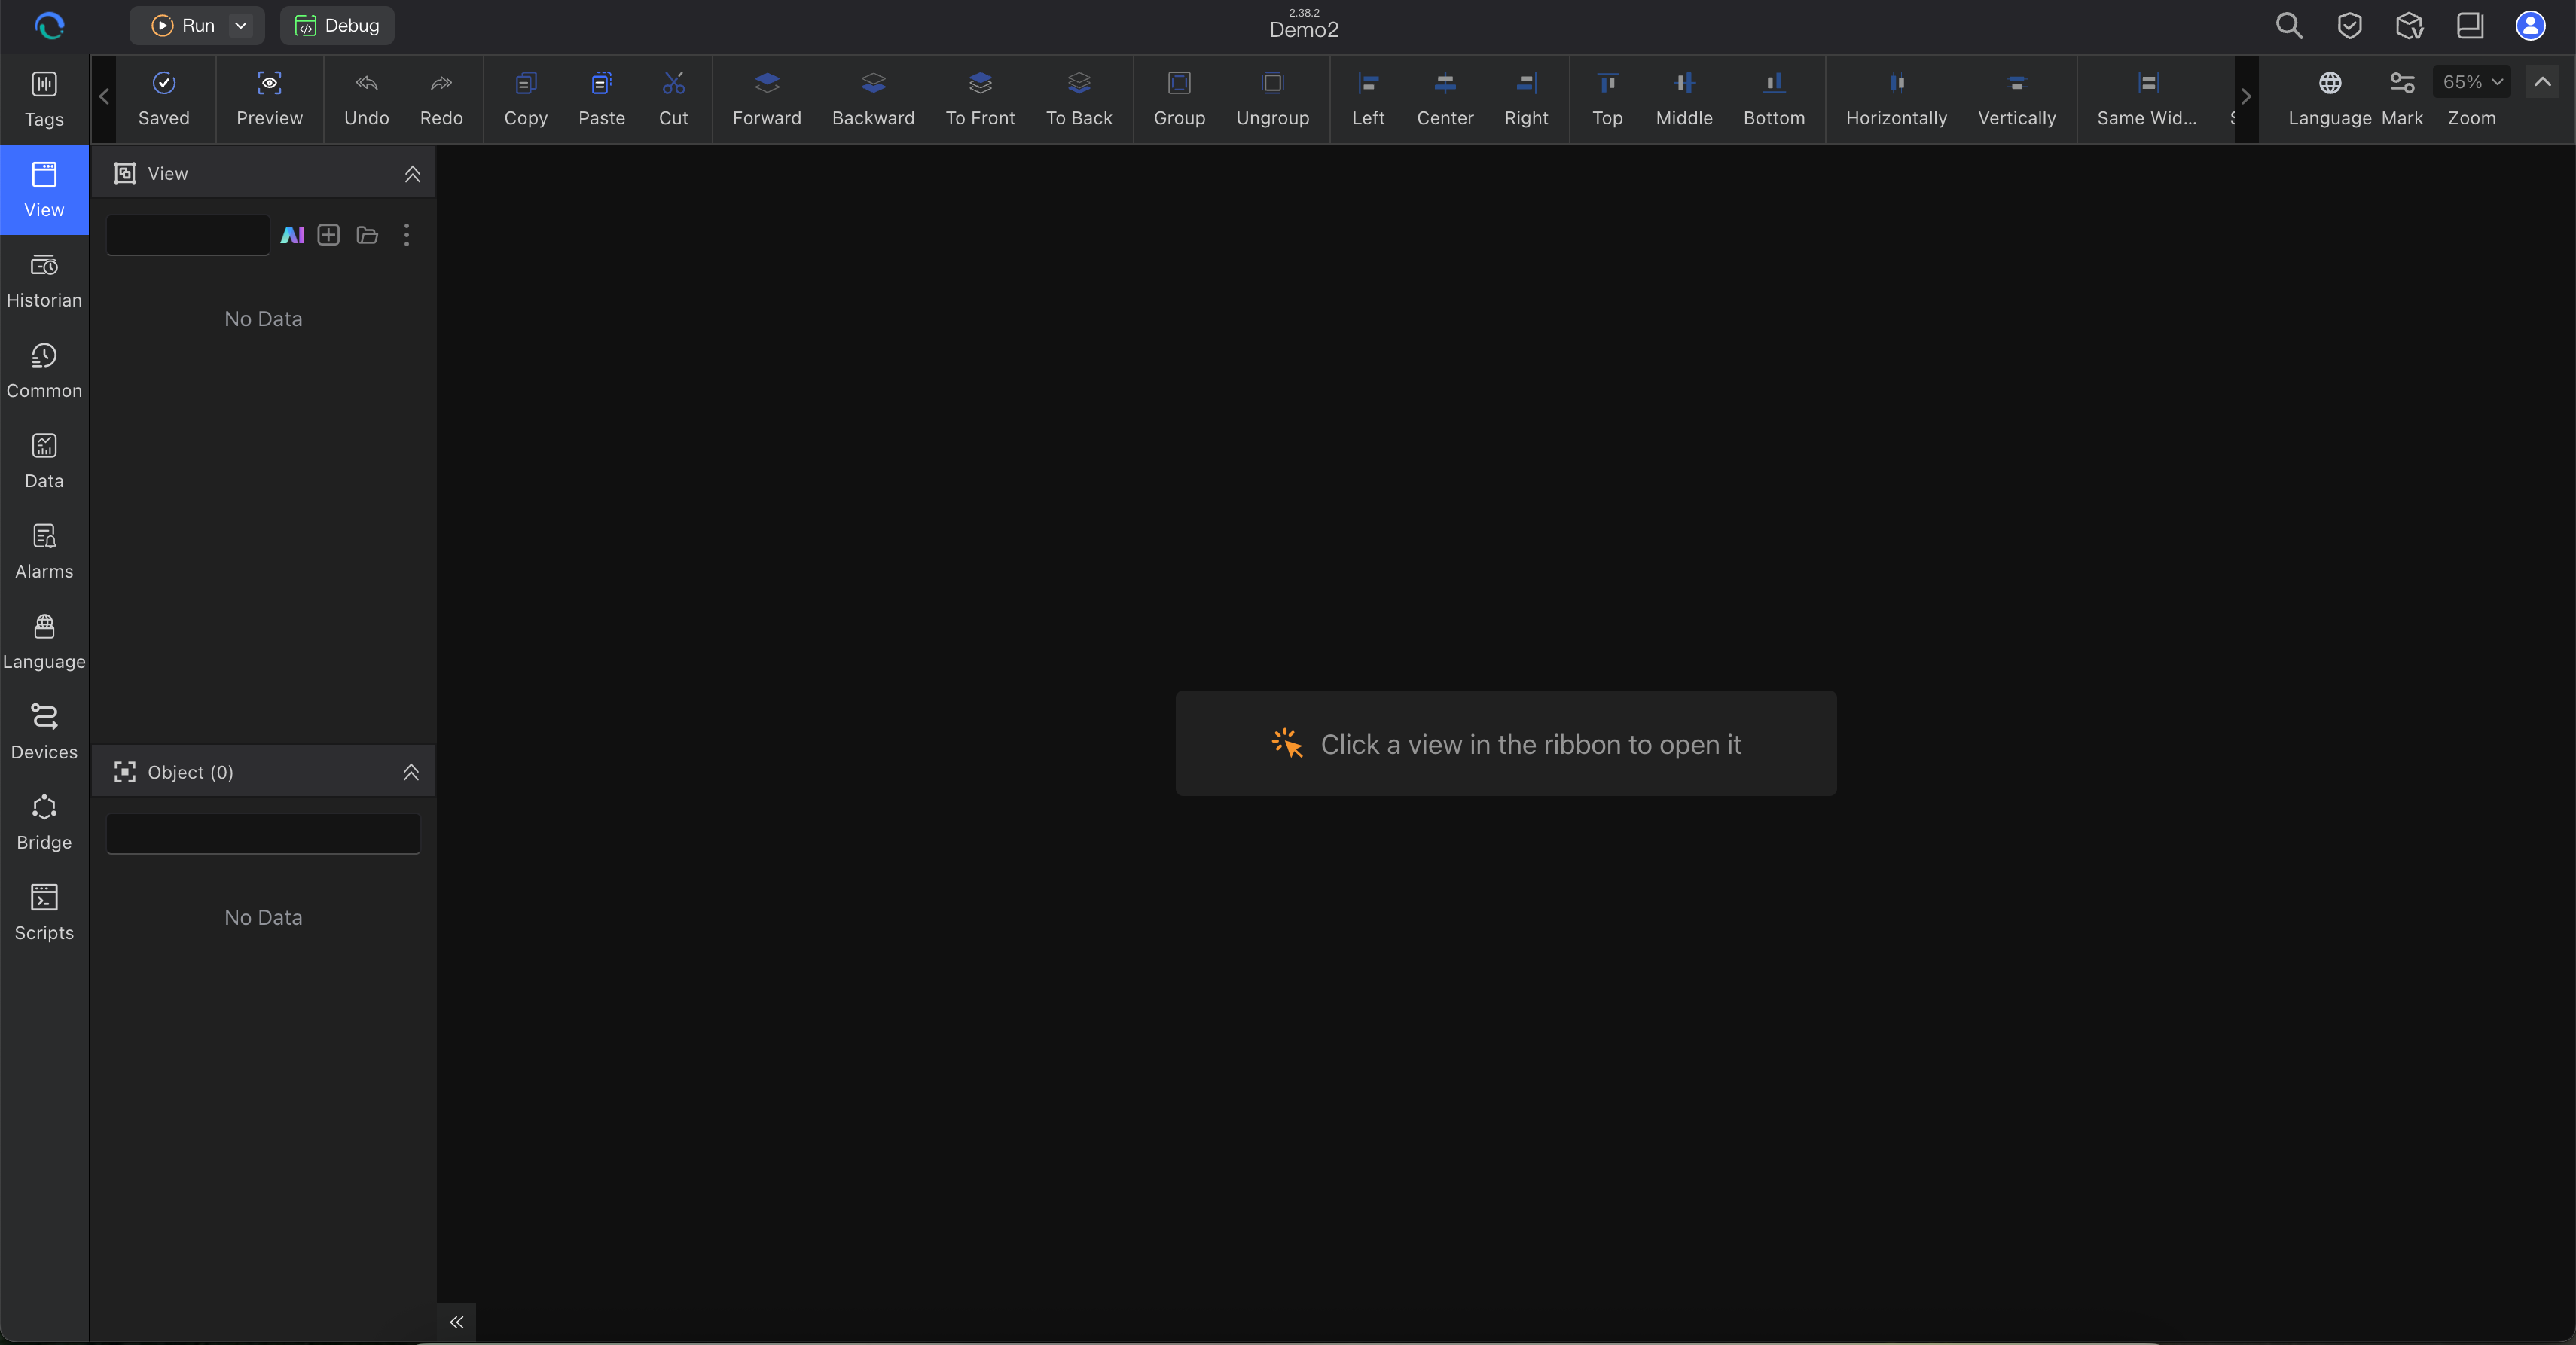
You should now see a blank project in Editor.
Step 2: Choose Your Tag Source
Choose one source:
- external tags from a real controller or device
- internal tags for simulation and early testing
Use these rules:
- choose external tags when you already know the protocol, address, and communication settings
- choose internal tags when you want to validate the engineering flow first and connect hardware later
- if this is your first time and no hardware is connected yet, start with internal tags
- use Static Simulation only when you want to keep the external-channel workflow from day 1
If you need a refresher, see Understanding Tags.
Step 3: Configure Tags
Option A: Use a Real Device with an External Channel
Open the tag area. Add a communication channel.
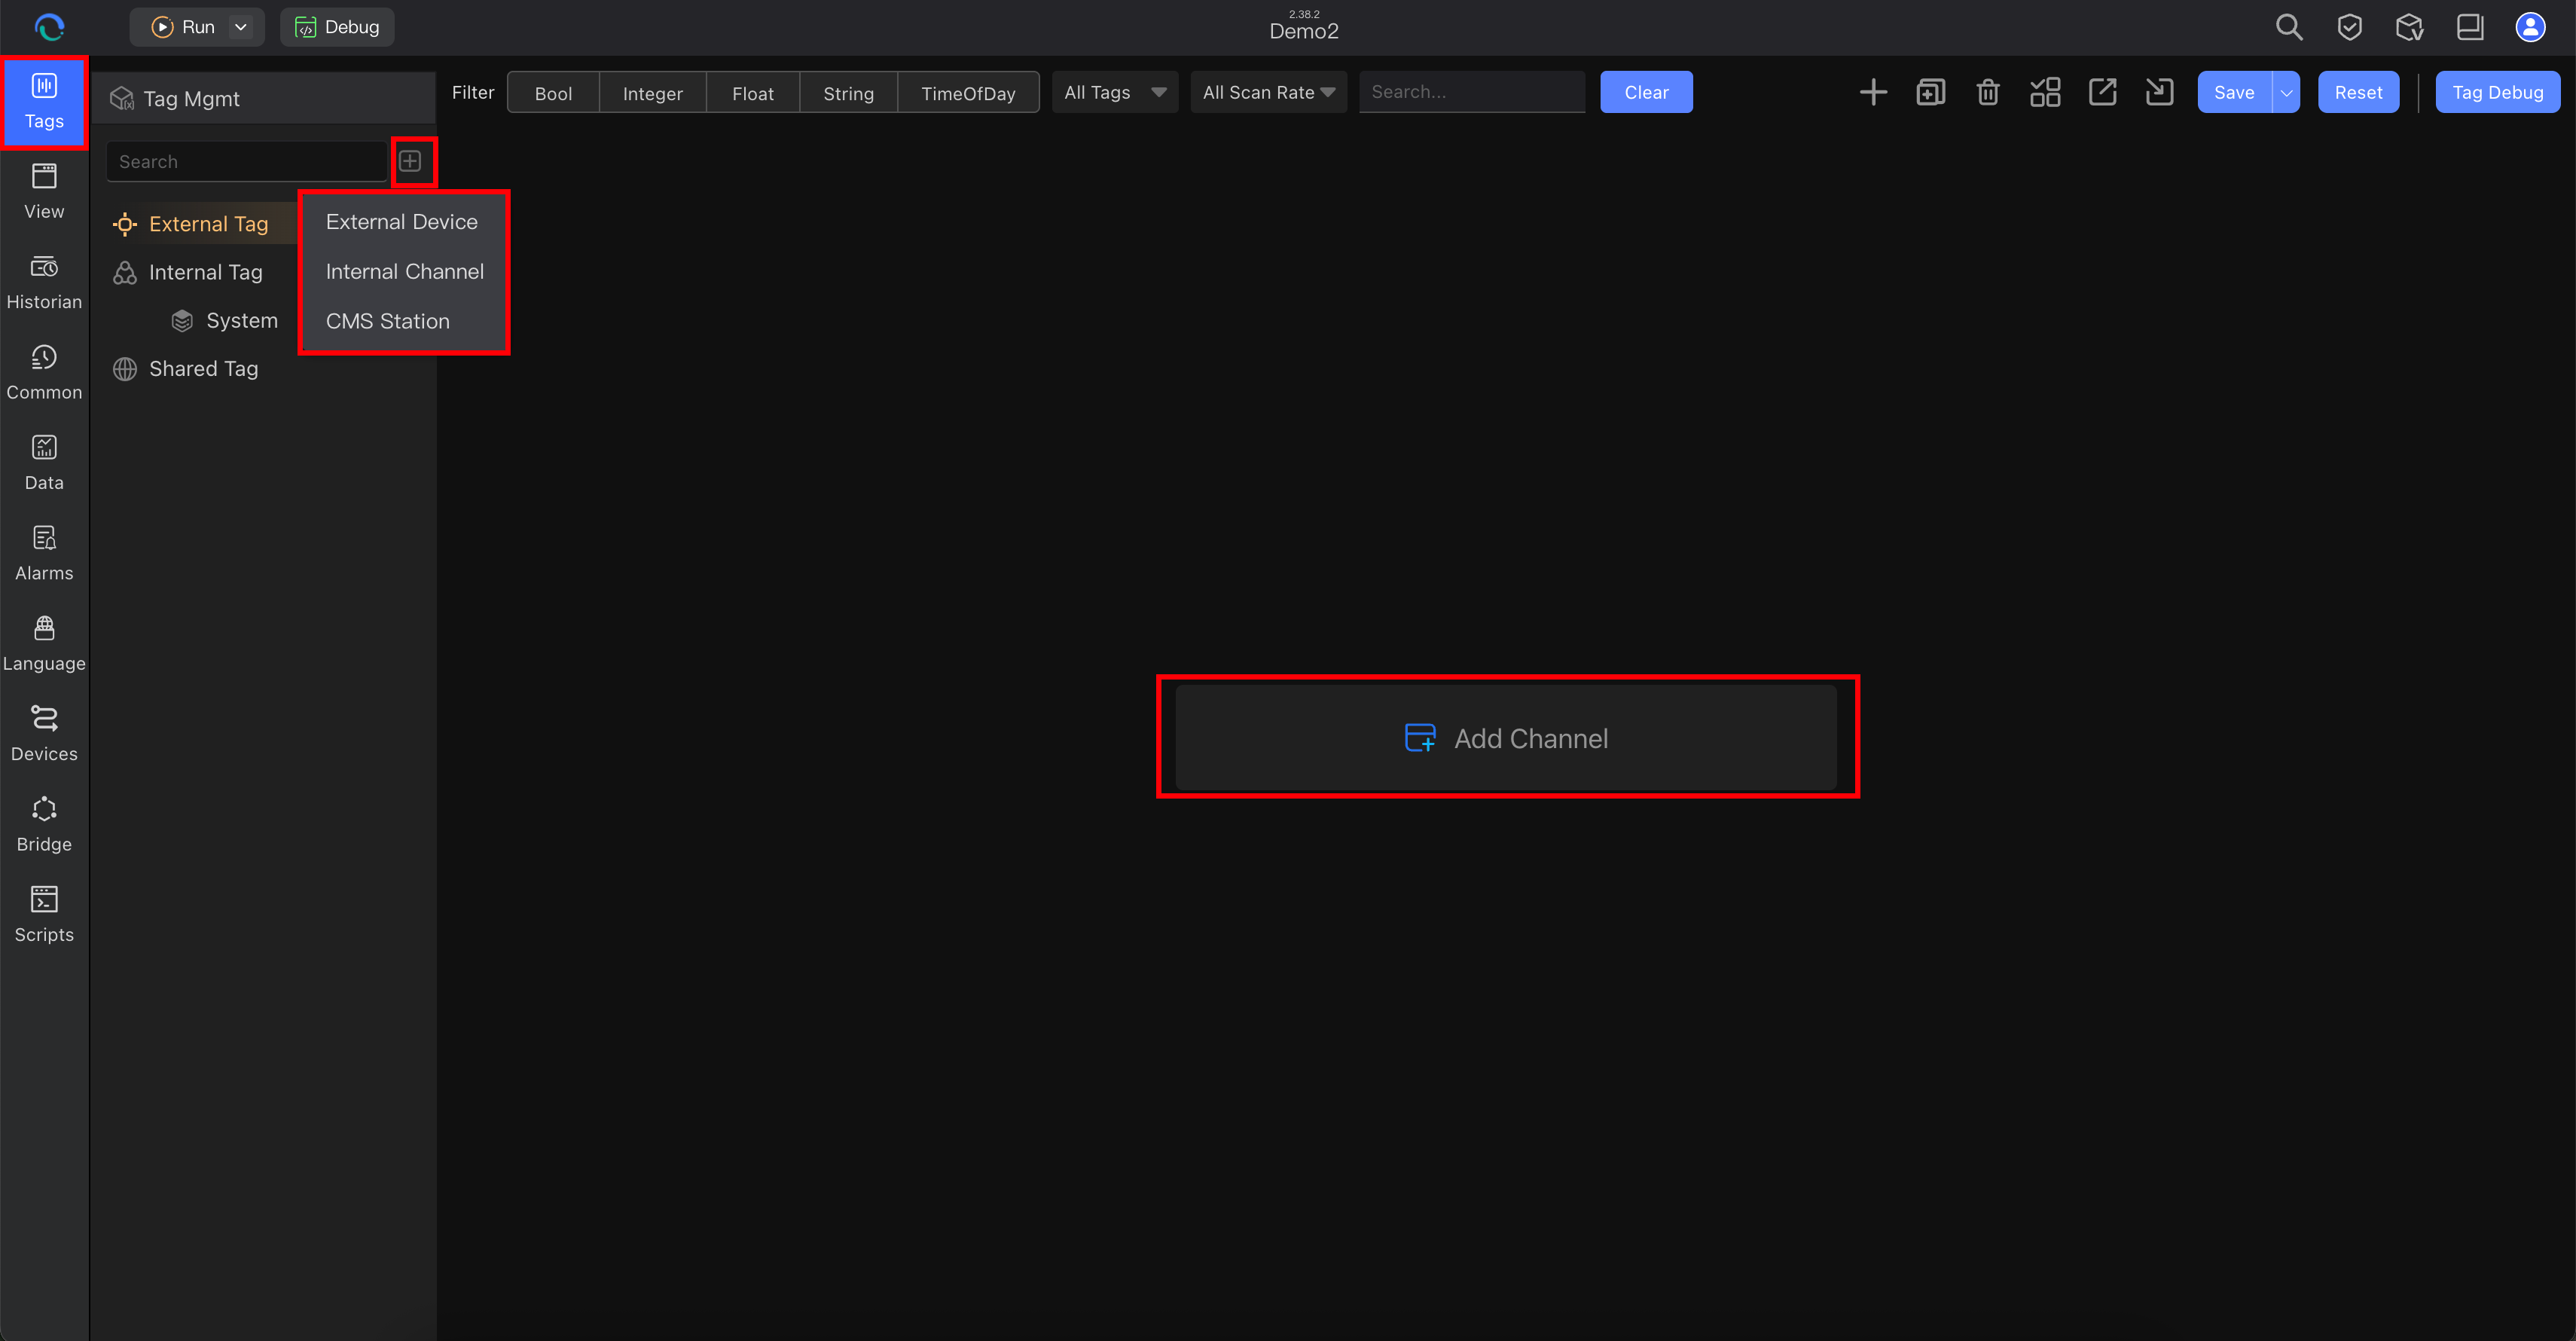
Select the protocol and fill in the channel connection details.
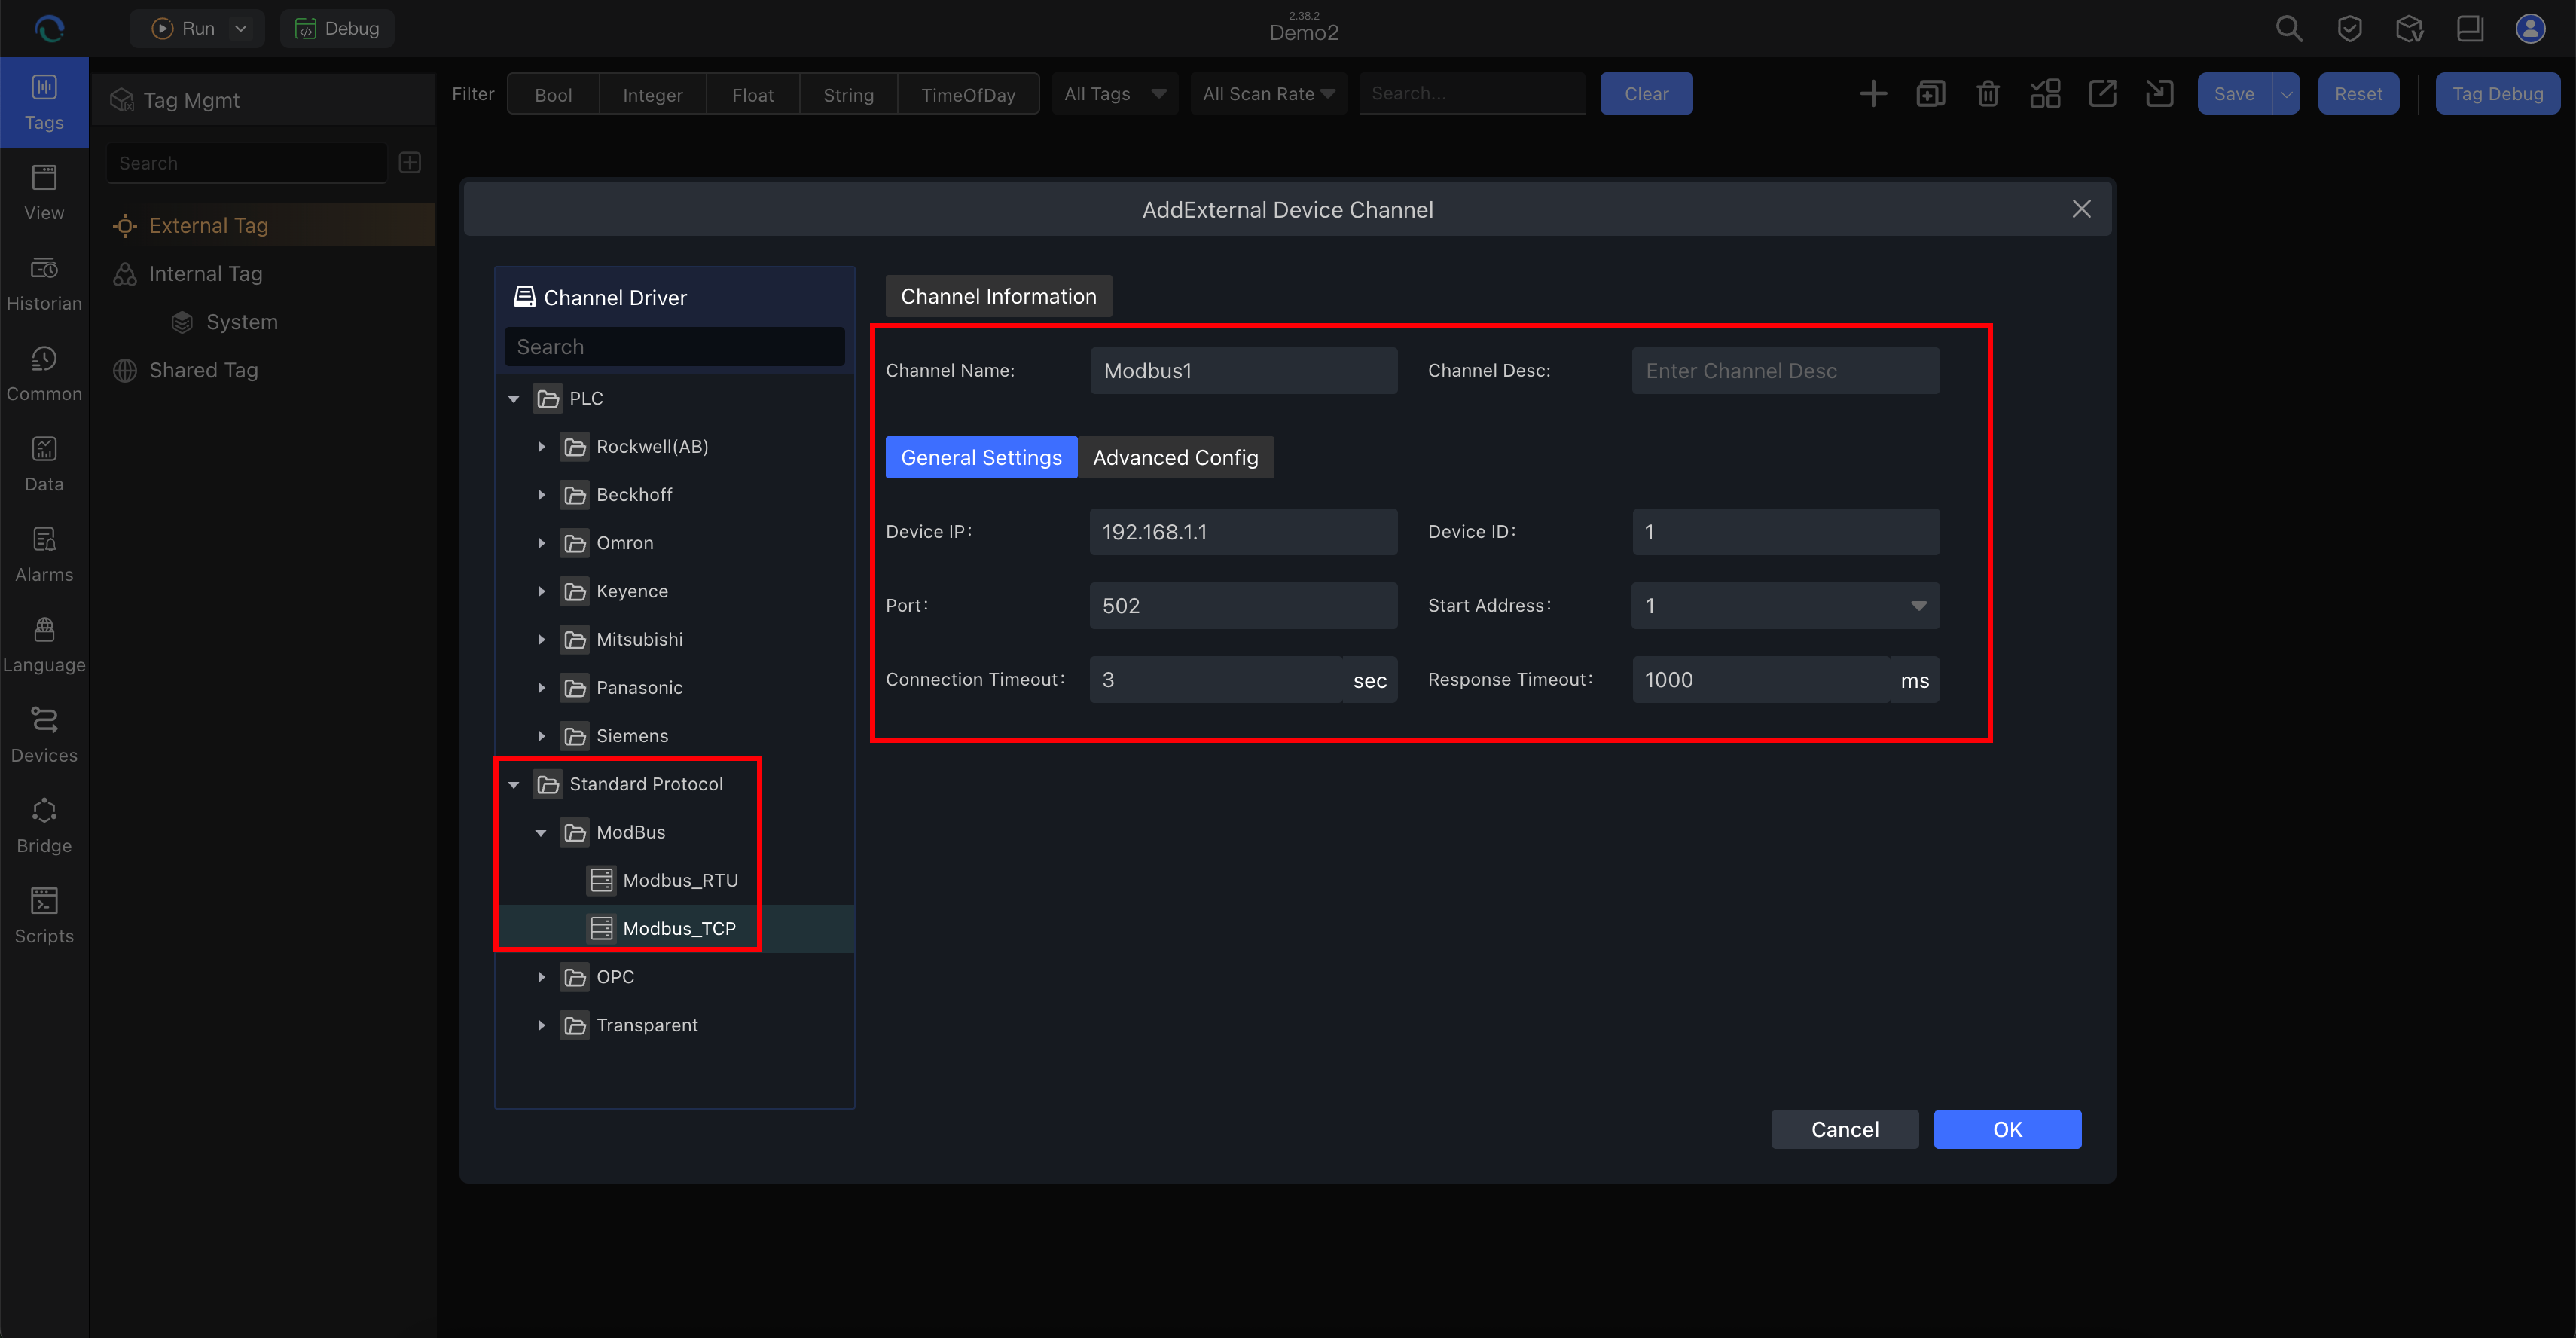
Path:
- Tags → External Tag → add a new channel
Fill in the channel settings:
- Protocol driver: for example
Modbus TCP,S7, orOPC UA - Channel name: use a meaningful name such as
PLC1orLine01_Controller - Connection parameters: IP address, port, rack/slot, or other driver-specific settings
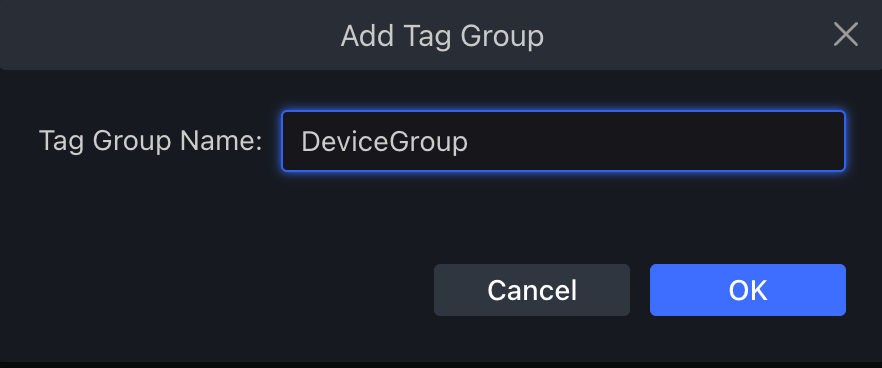
Create a tag group under that channel.
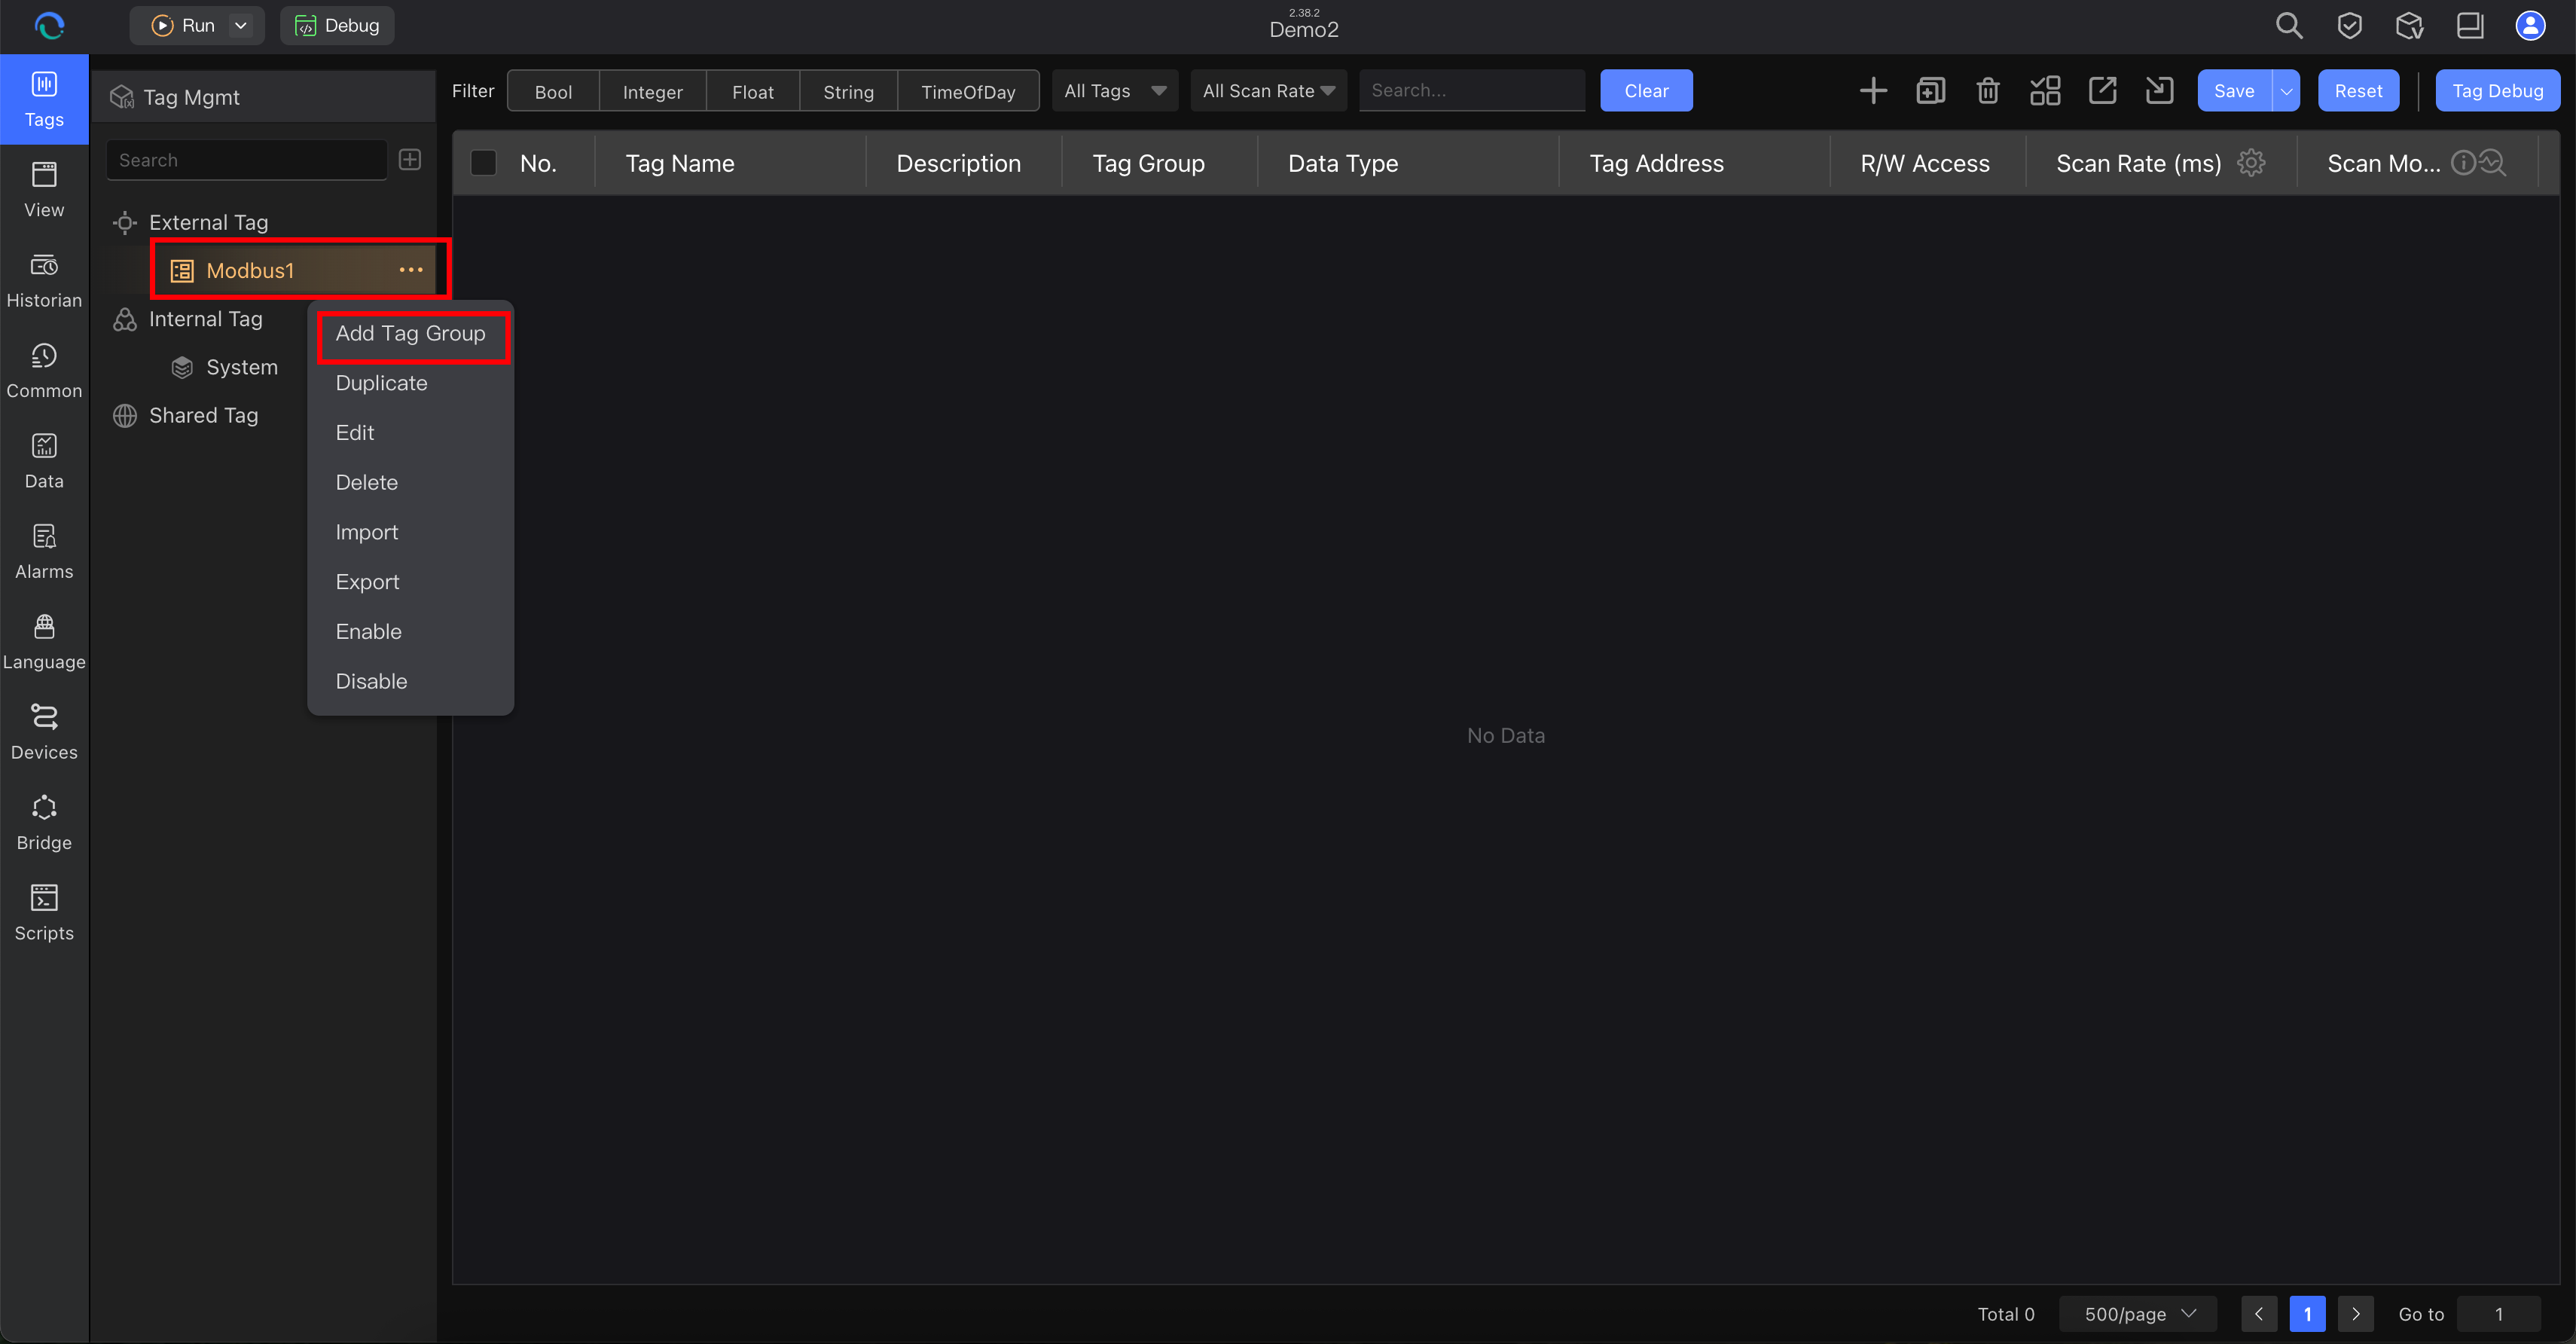
Enter the tag group name, for example DeviceGroup.
Use the tag group to organize points by equipment area or function, for example:
BoilerStation1MotorStatus
Create your first tags.
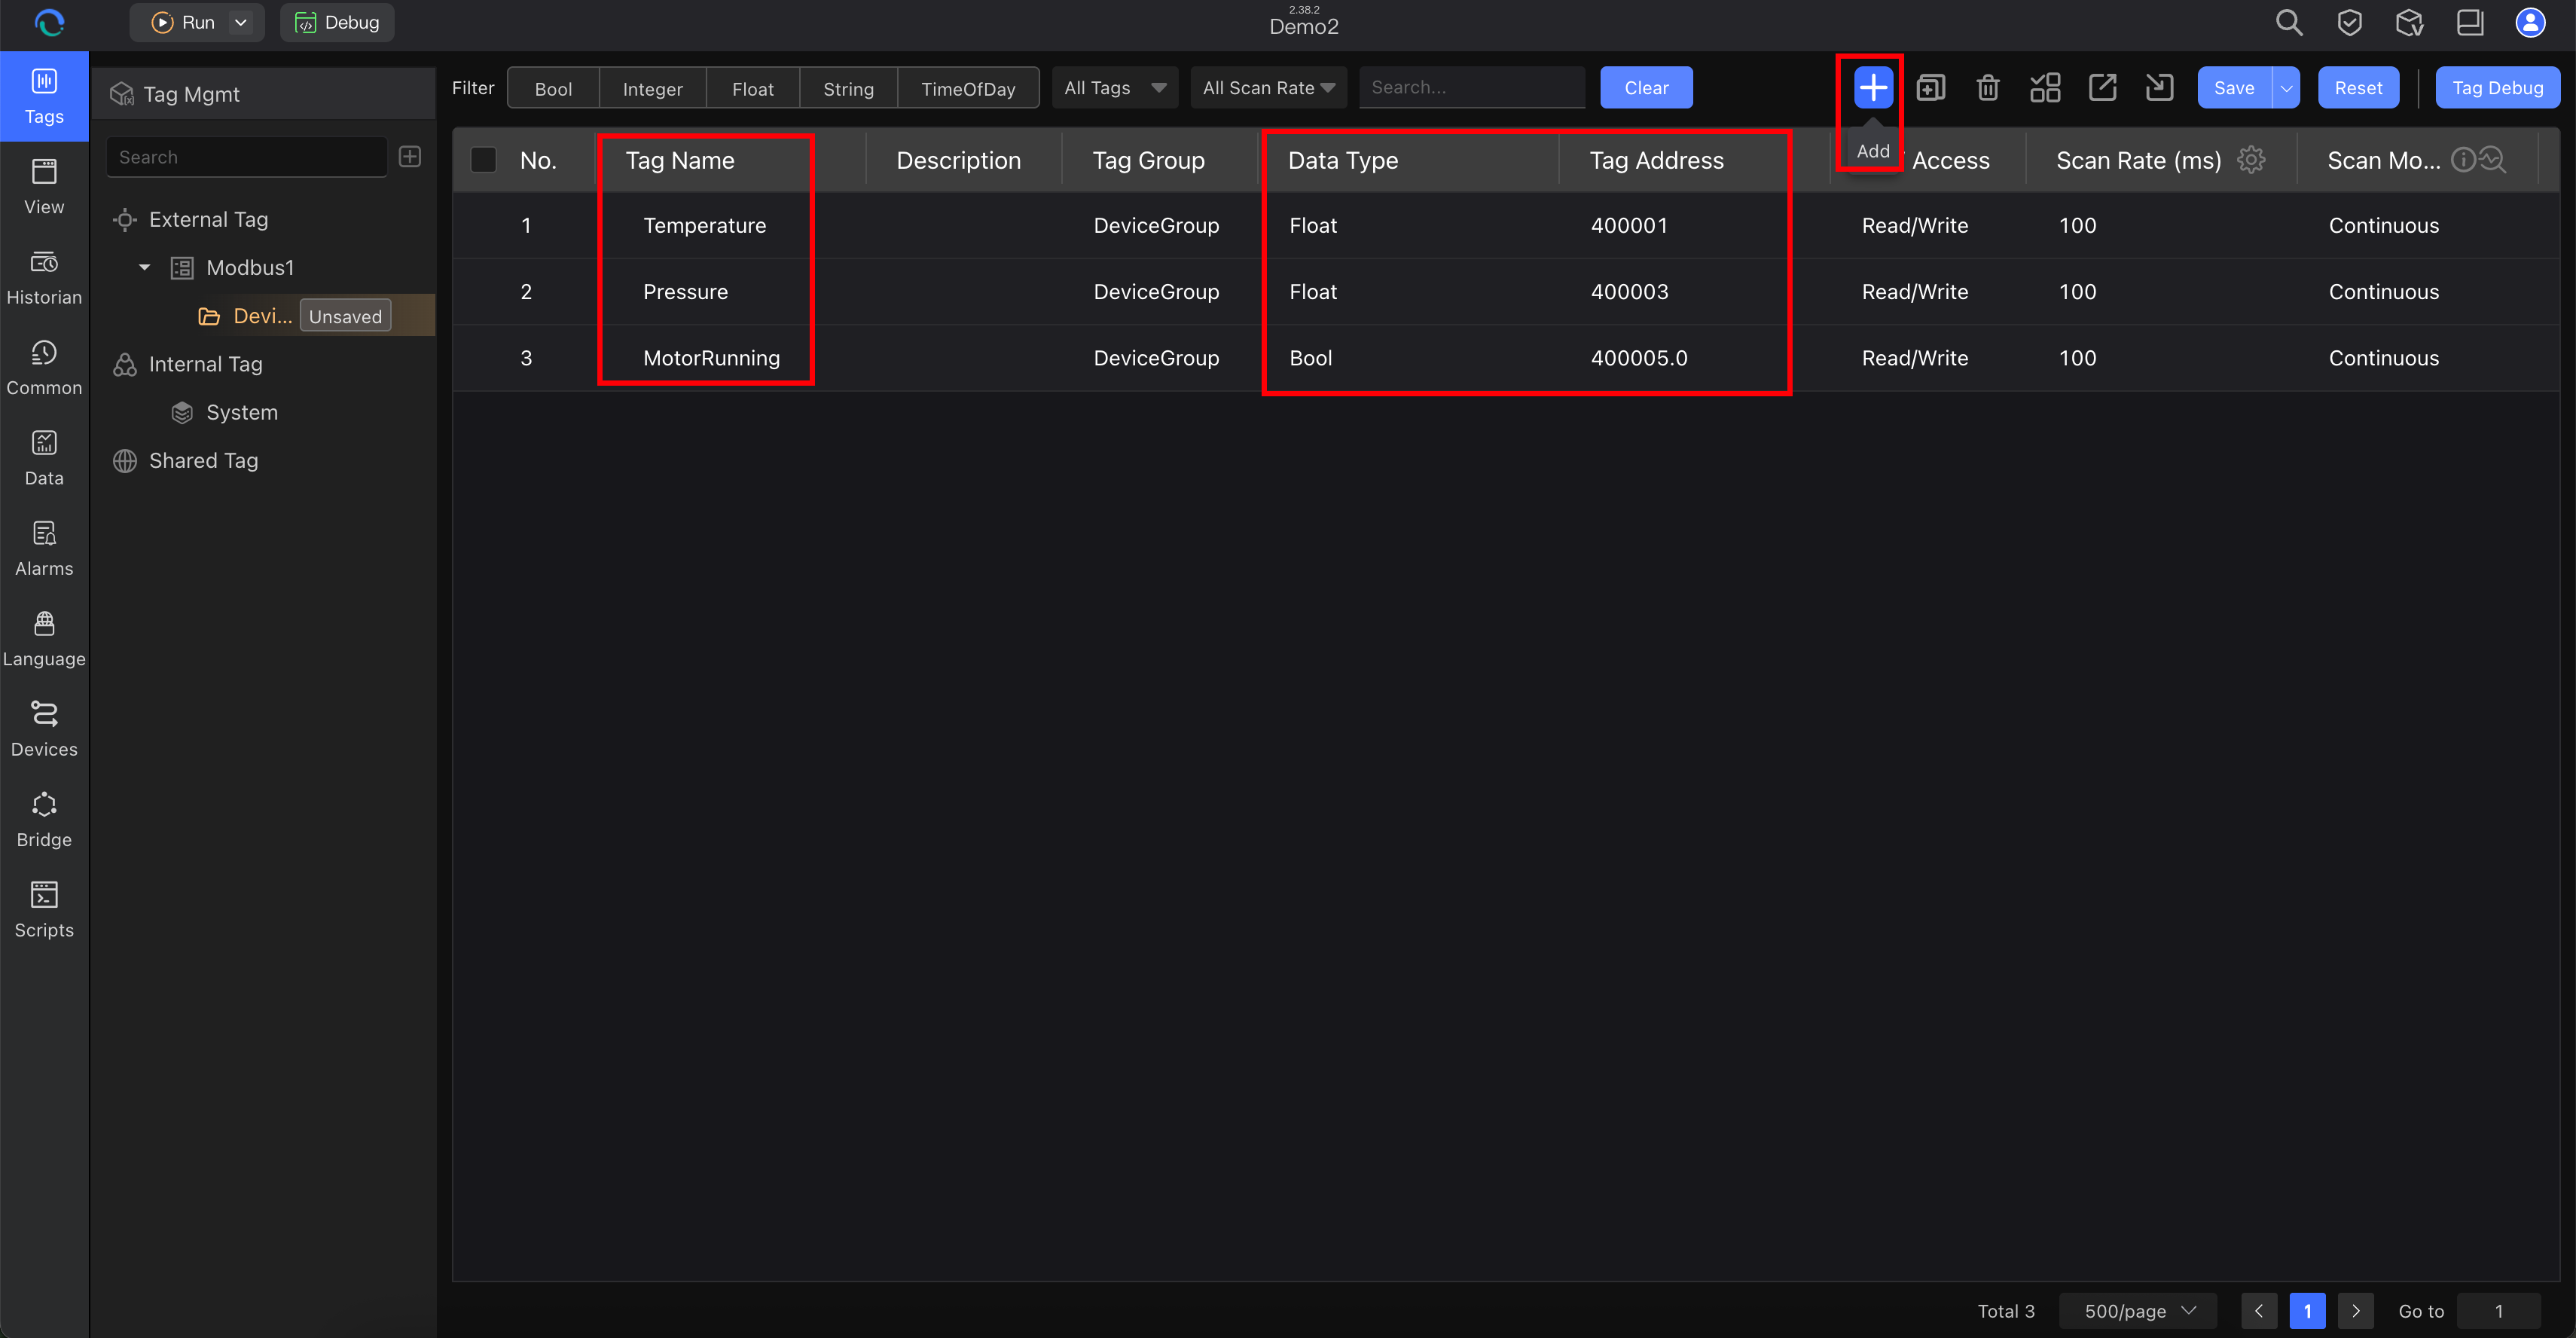
After editing the external tags, save the configuration.
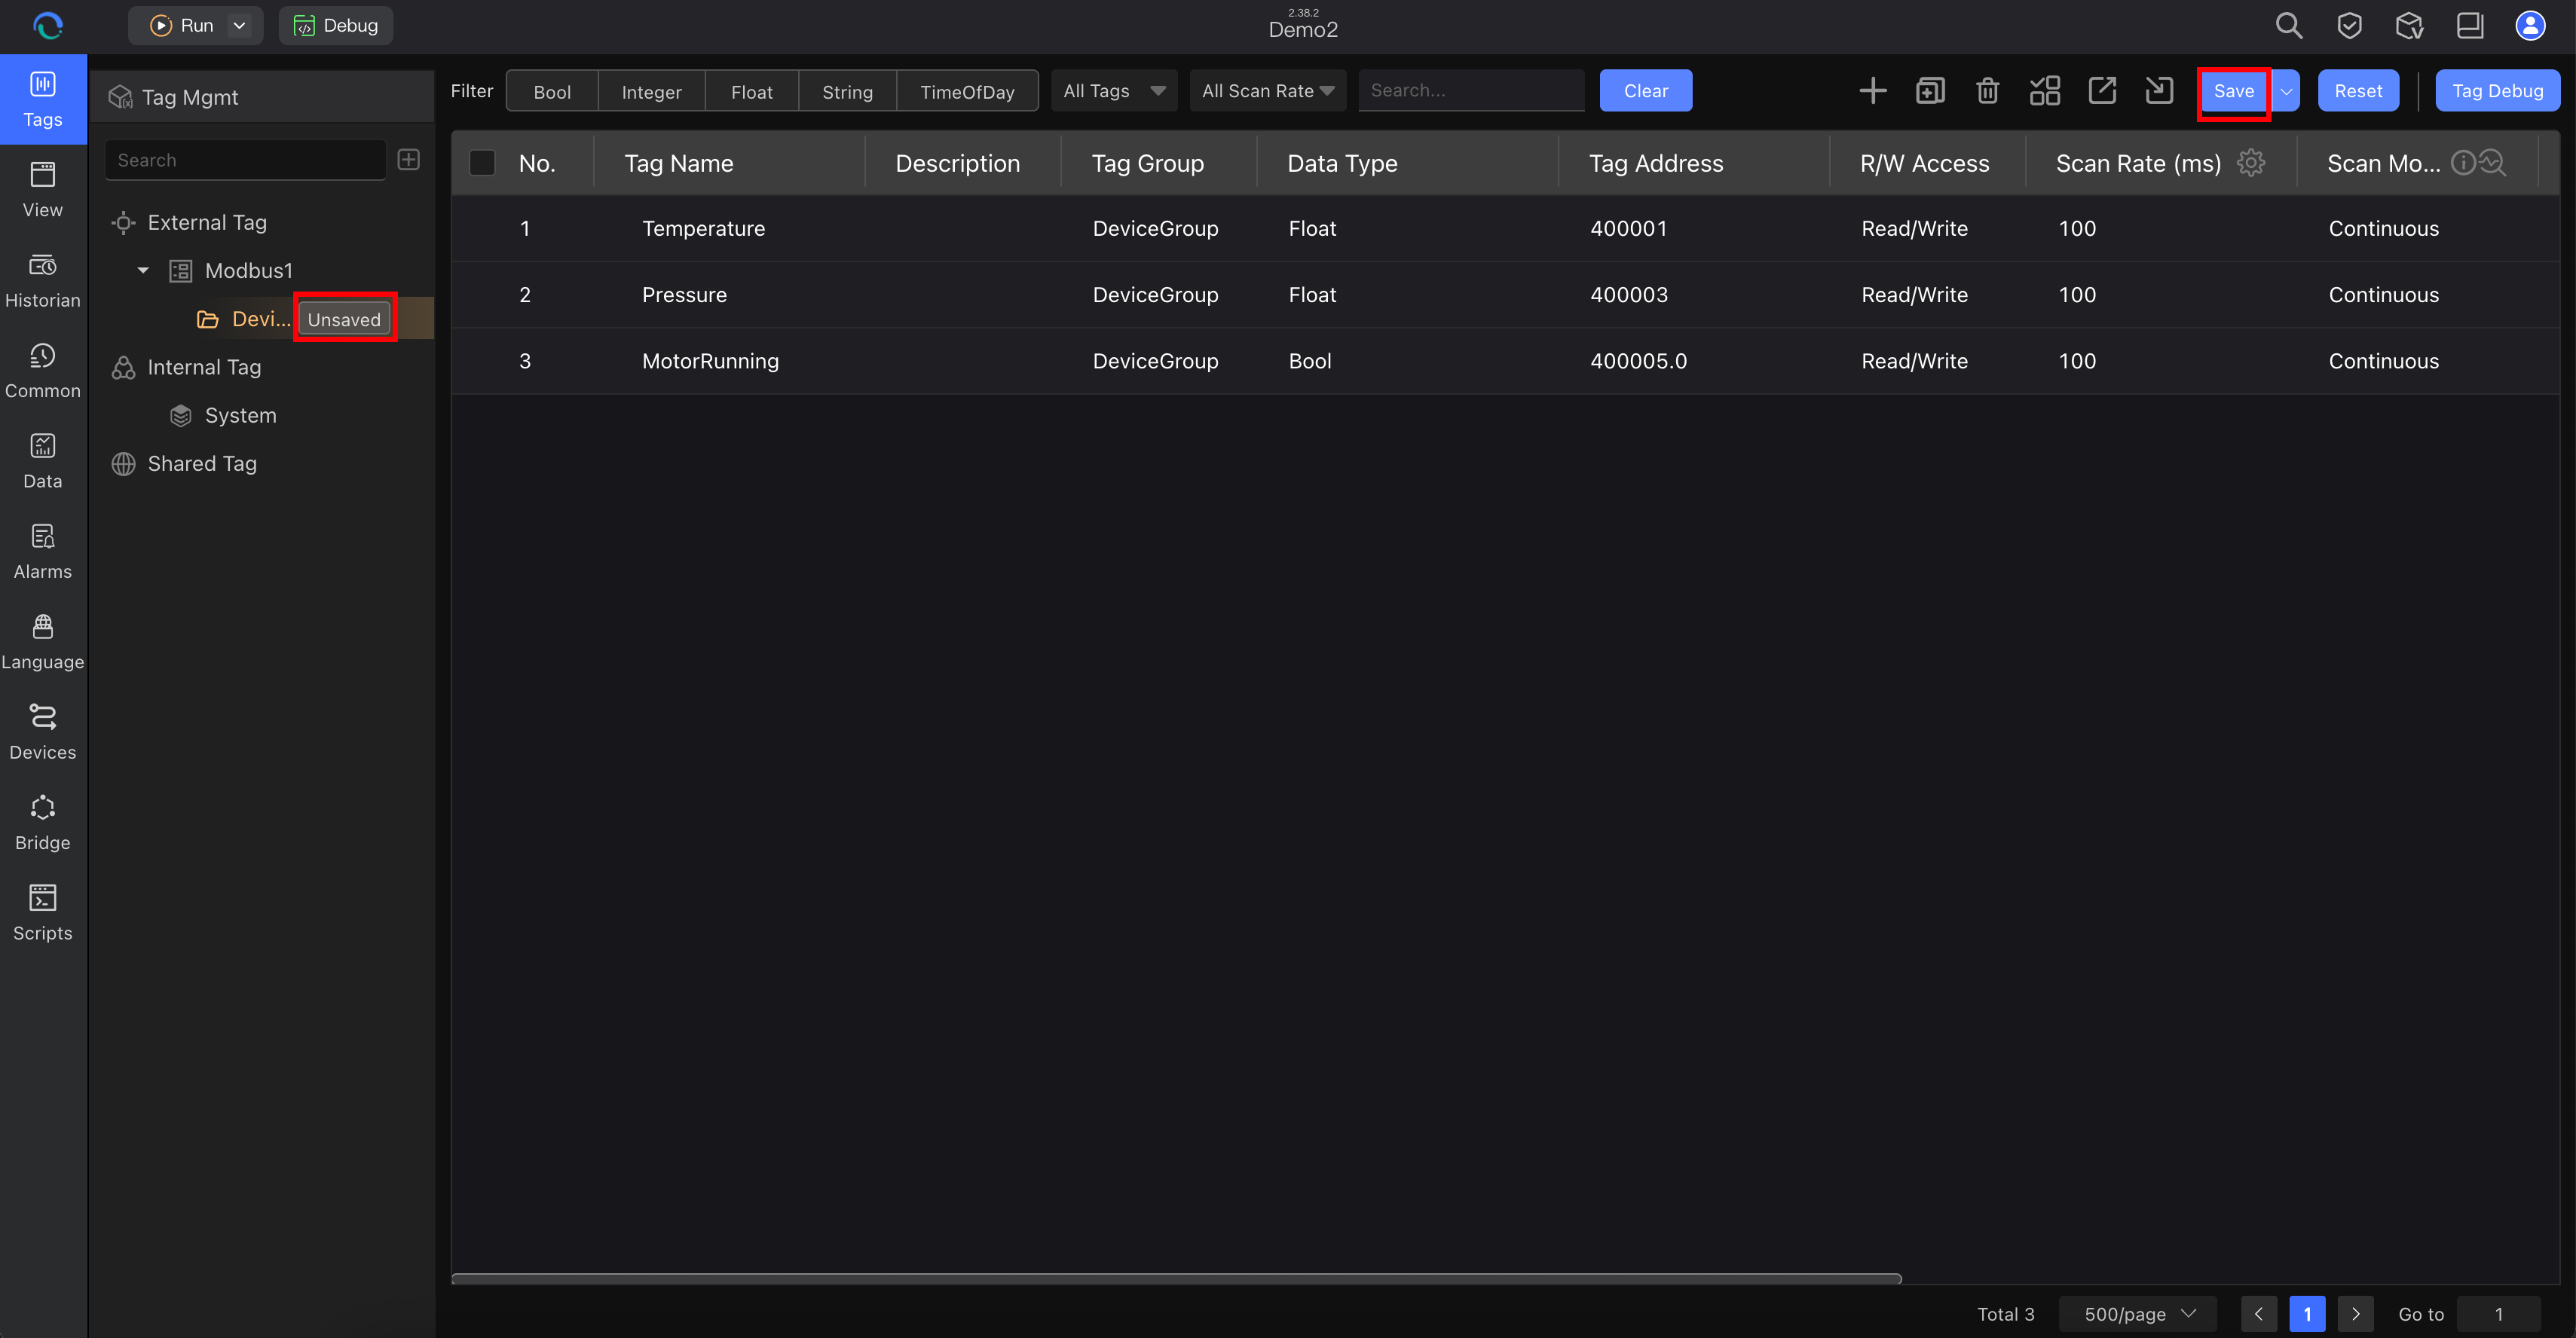
Recommended starter set:
| Tag Name | Type | Example Address | Purpose |
|---|---|---|---|
Temperature | Float | 40001 | analog process value |
Pressure | Float | 40002 | analog process value |
MotorRunning | Bool | 30001 | status bit |
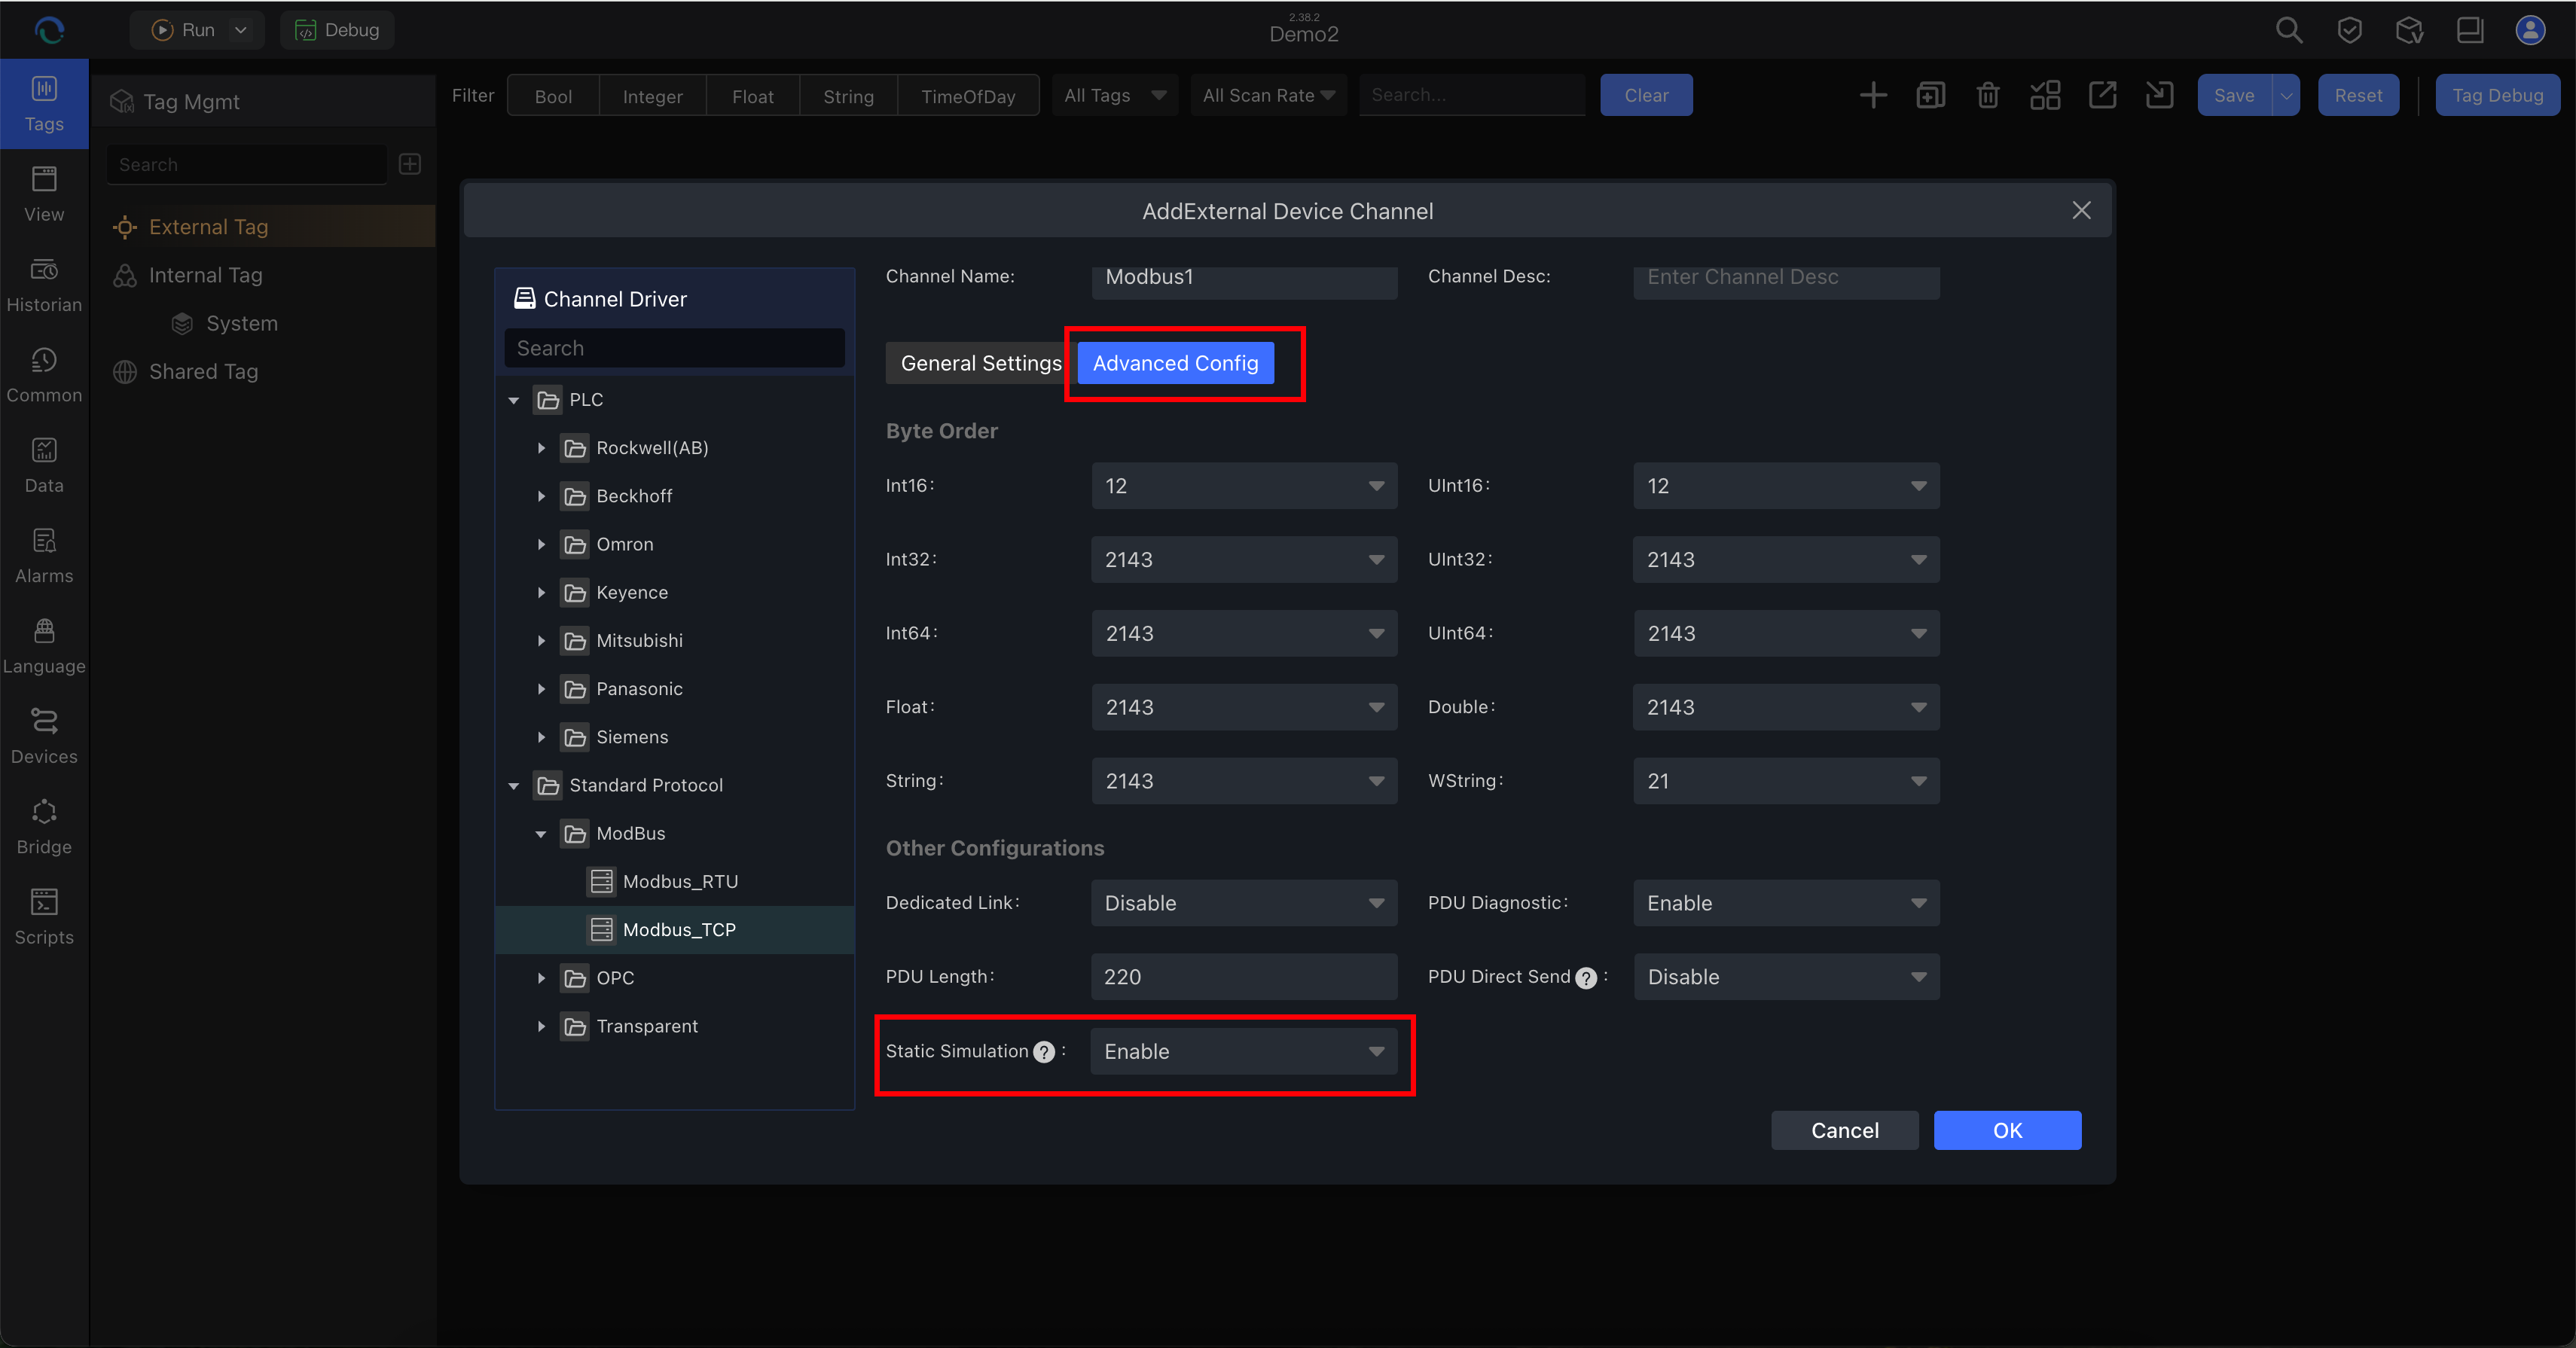
Option B: Use an External Channel with Static Simulation
If you want to keep the external-channel workflow without a real PLC, enable Static Simulation after the channel and external tags are defined.
Recommended use case:
- you want to validate channel setup and external tags before hardware arrives
- you want to simulate PLC-style read/write behavior during engineering
Path:
- create the external channel as usual
- create the required external tags under that channel
- open the channel Advanced Config
- enable Static Simulation
- save the channel
Result:
- you can test channel and tag configuration without an actual PLC connection
- you can read and write external tag values during offline engineering
- you keep a workflow closer to the final production structure
Important:
- use Static Simulation only for offline testing
- disable it when a real PLC or device is connected
Option C: Use Internal Tags with No Device
If you do not have hardware yet, create internal tags instead.
Path:
- Tags → Internal Tag
Then:
- create or select an internal channel
- add the same starter tags you would use for a real device
- set the tag names and data types
- save the configuration
Use the same three starter tags:
TemperaturePressureMotorRunning
This lets you finish the workflow now and replace the tag source later.
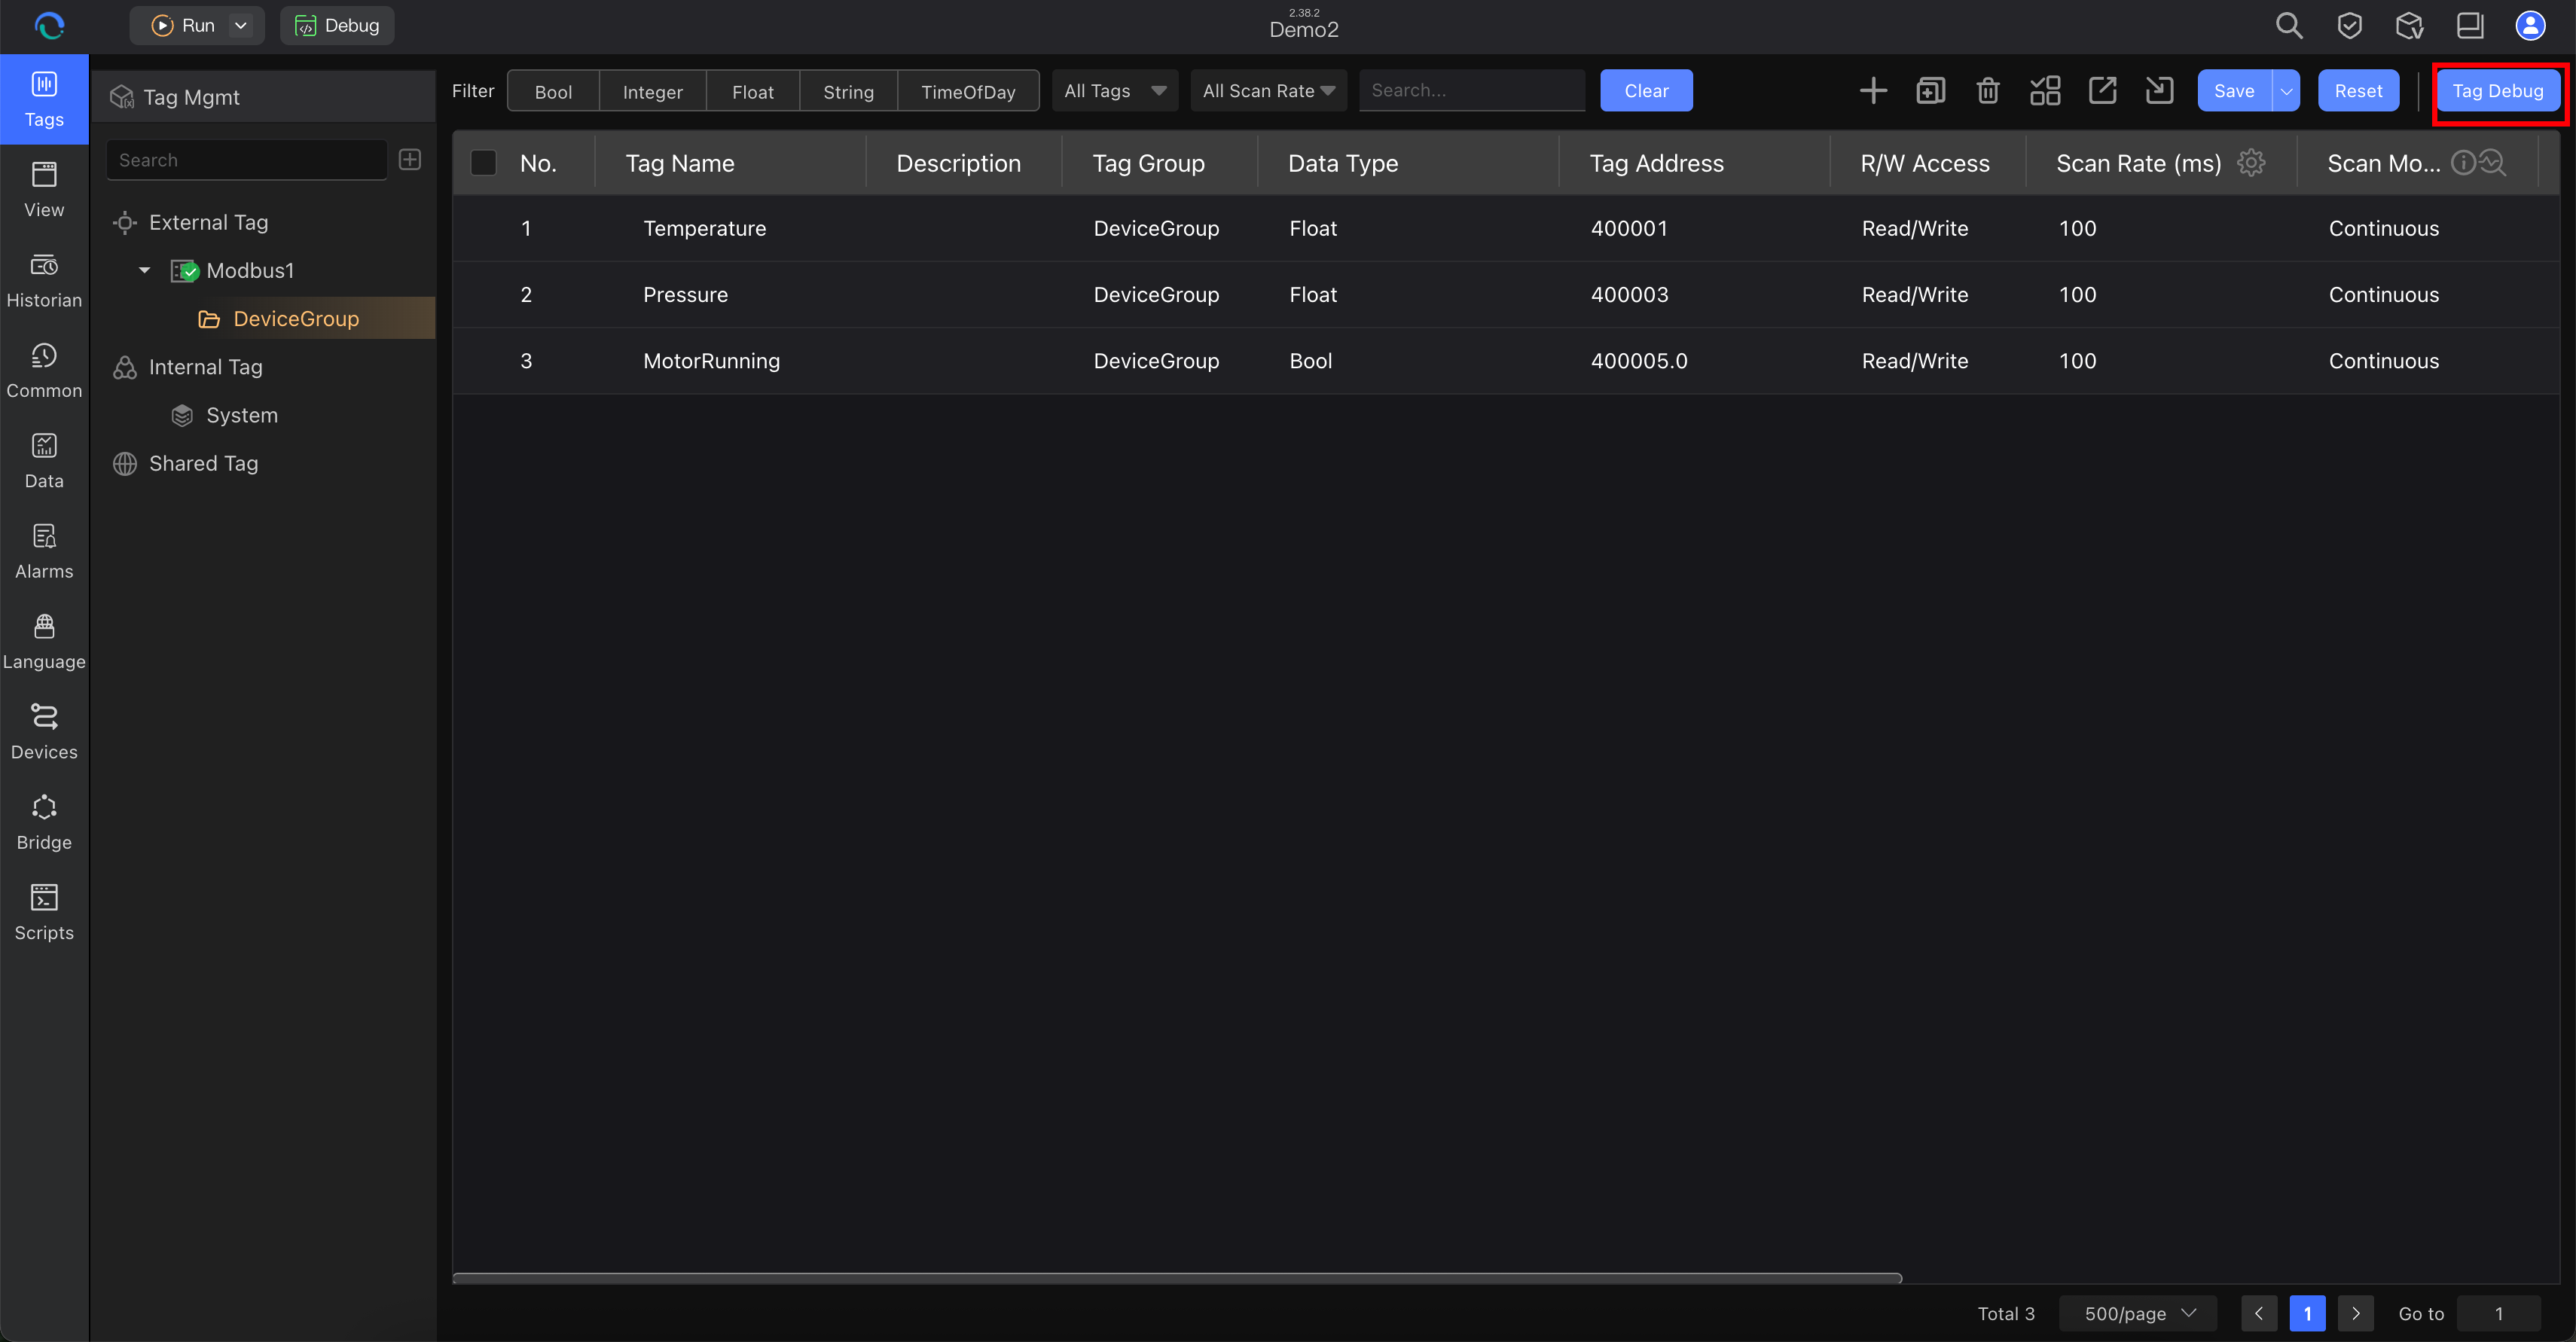
Step 4: Verify Tag Values Before Building the Page
Before you build the page, confirm that at least one tag can show or accept a value.
Recommended path:
- stay in Tag Manager (the Tags area)
- click Start Debug in the toolbar
- verify the current value, quality, or write behavior before moving on
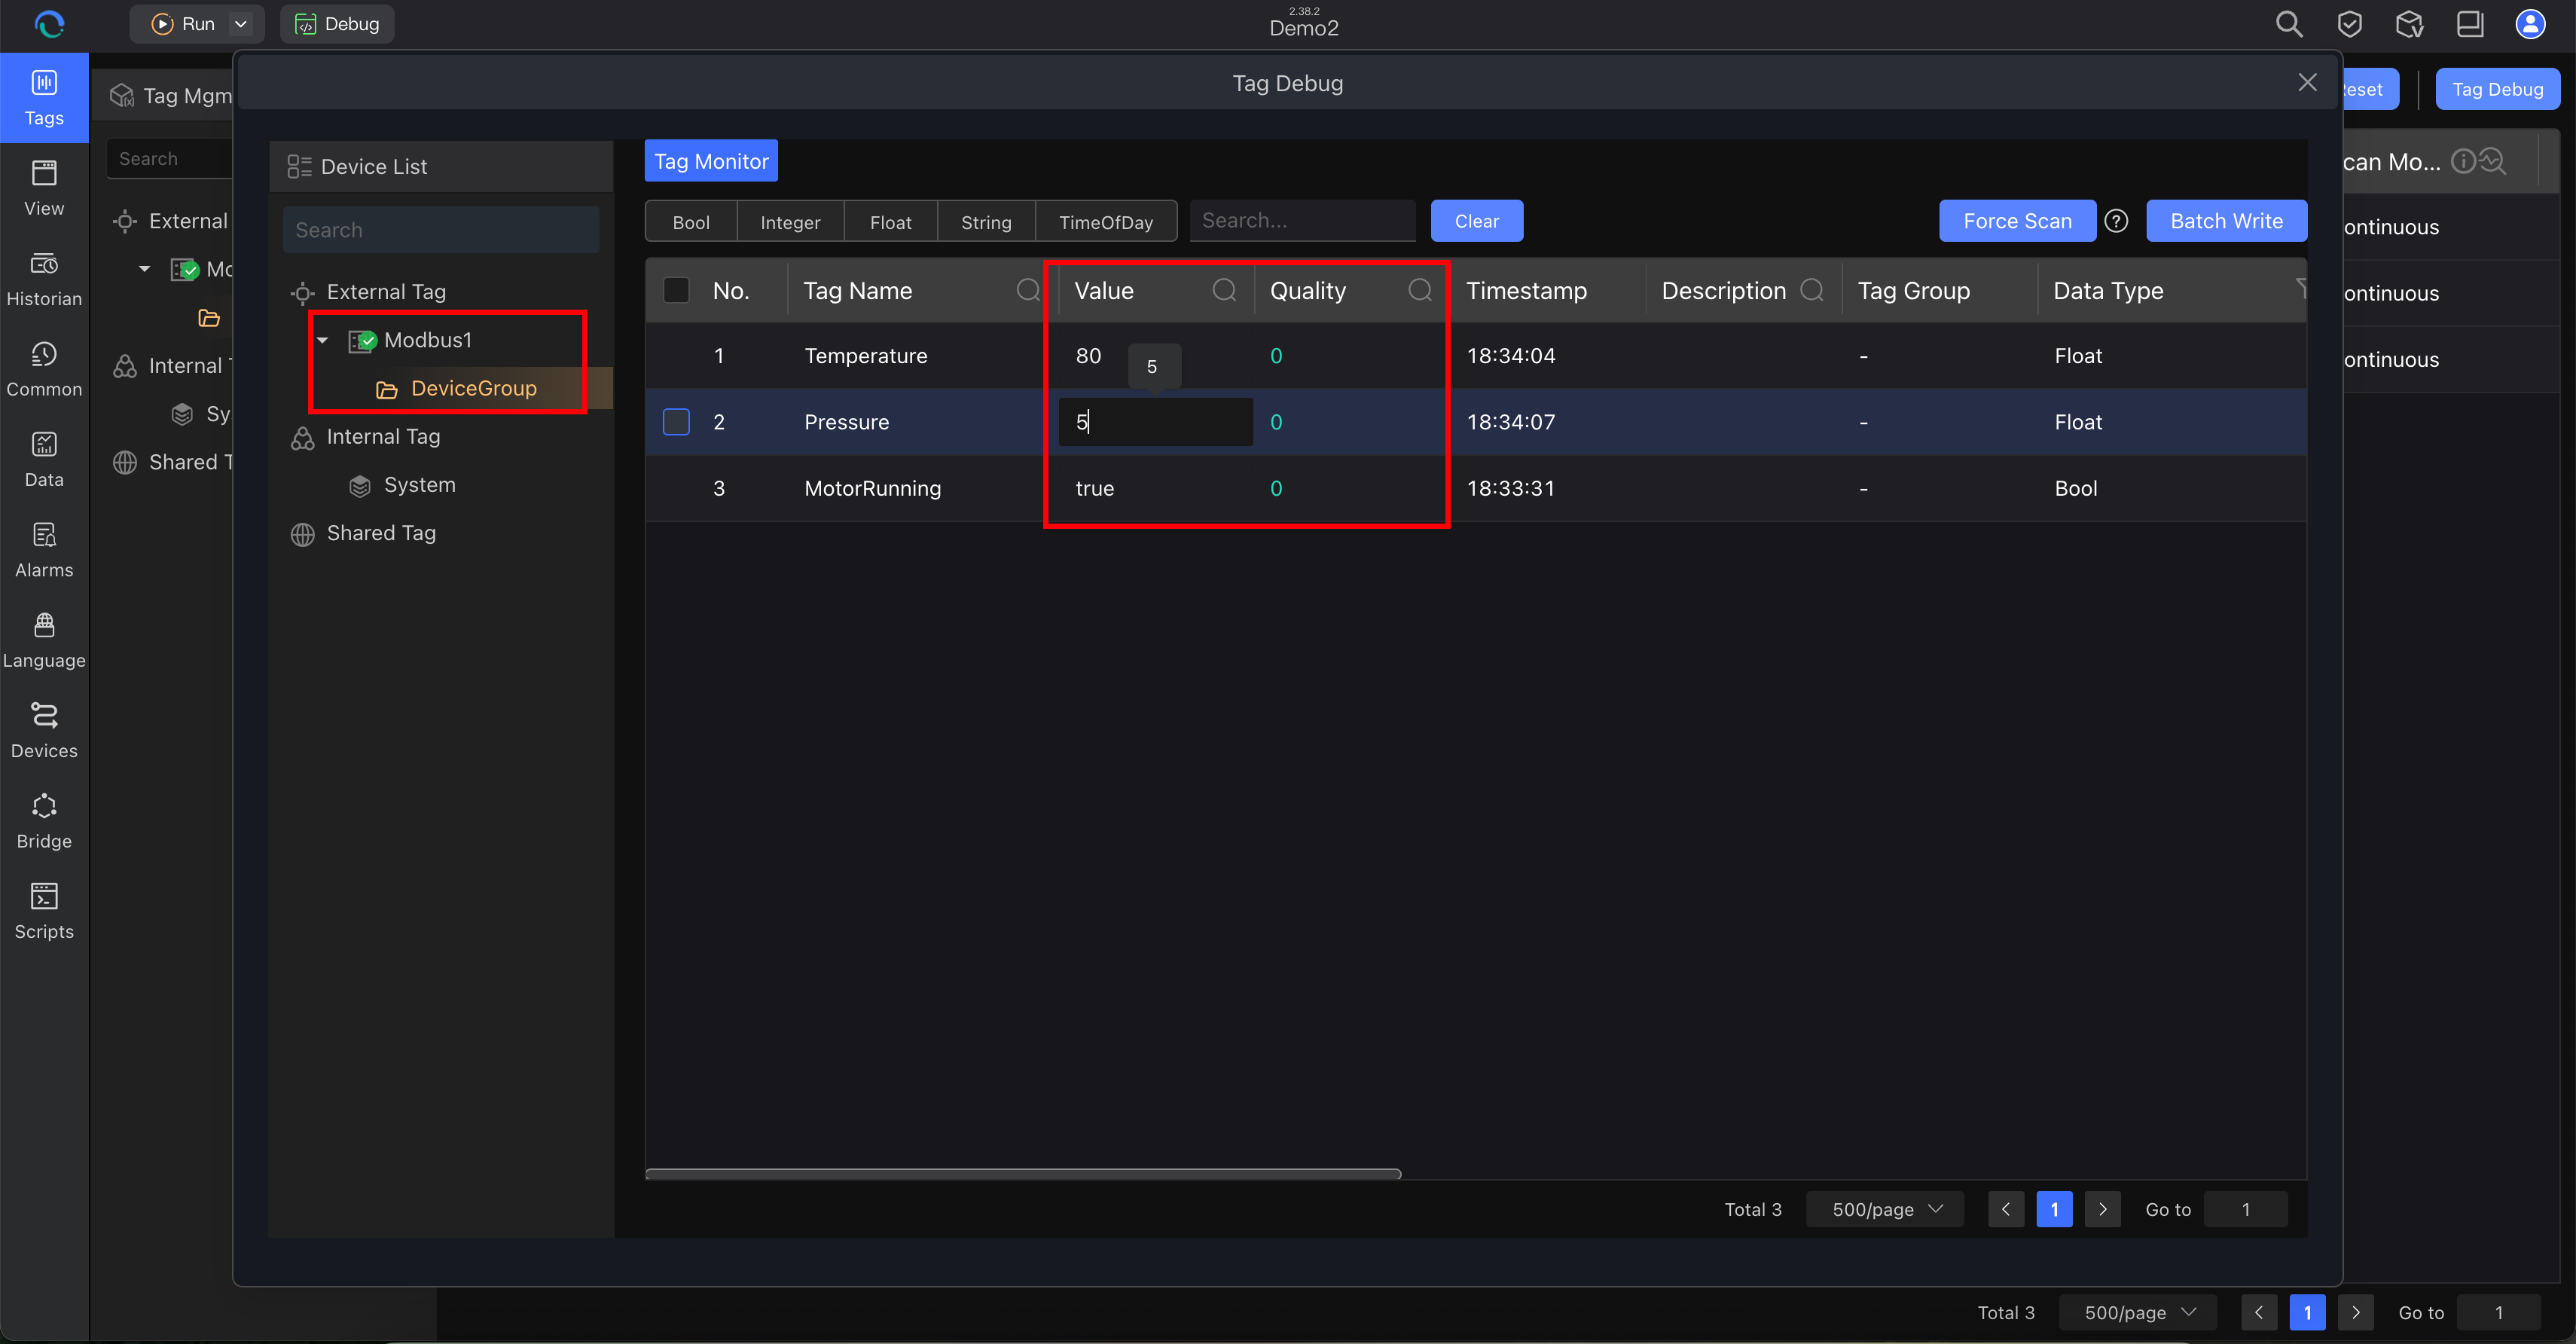
Use this check based on your setup:
- Real device: confirm that tag values are updating and quality is normal
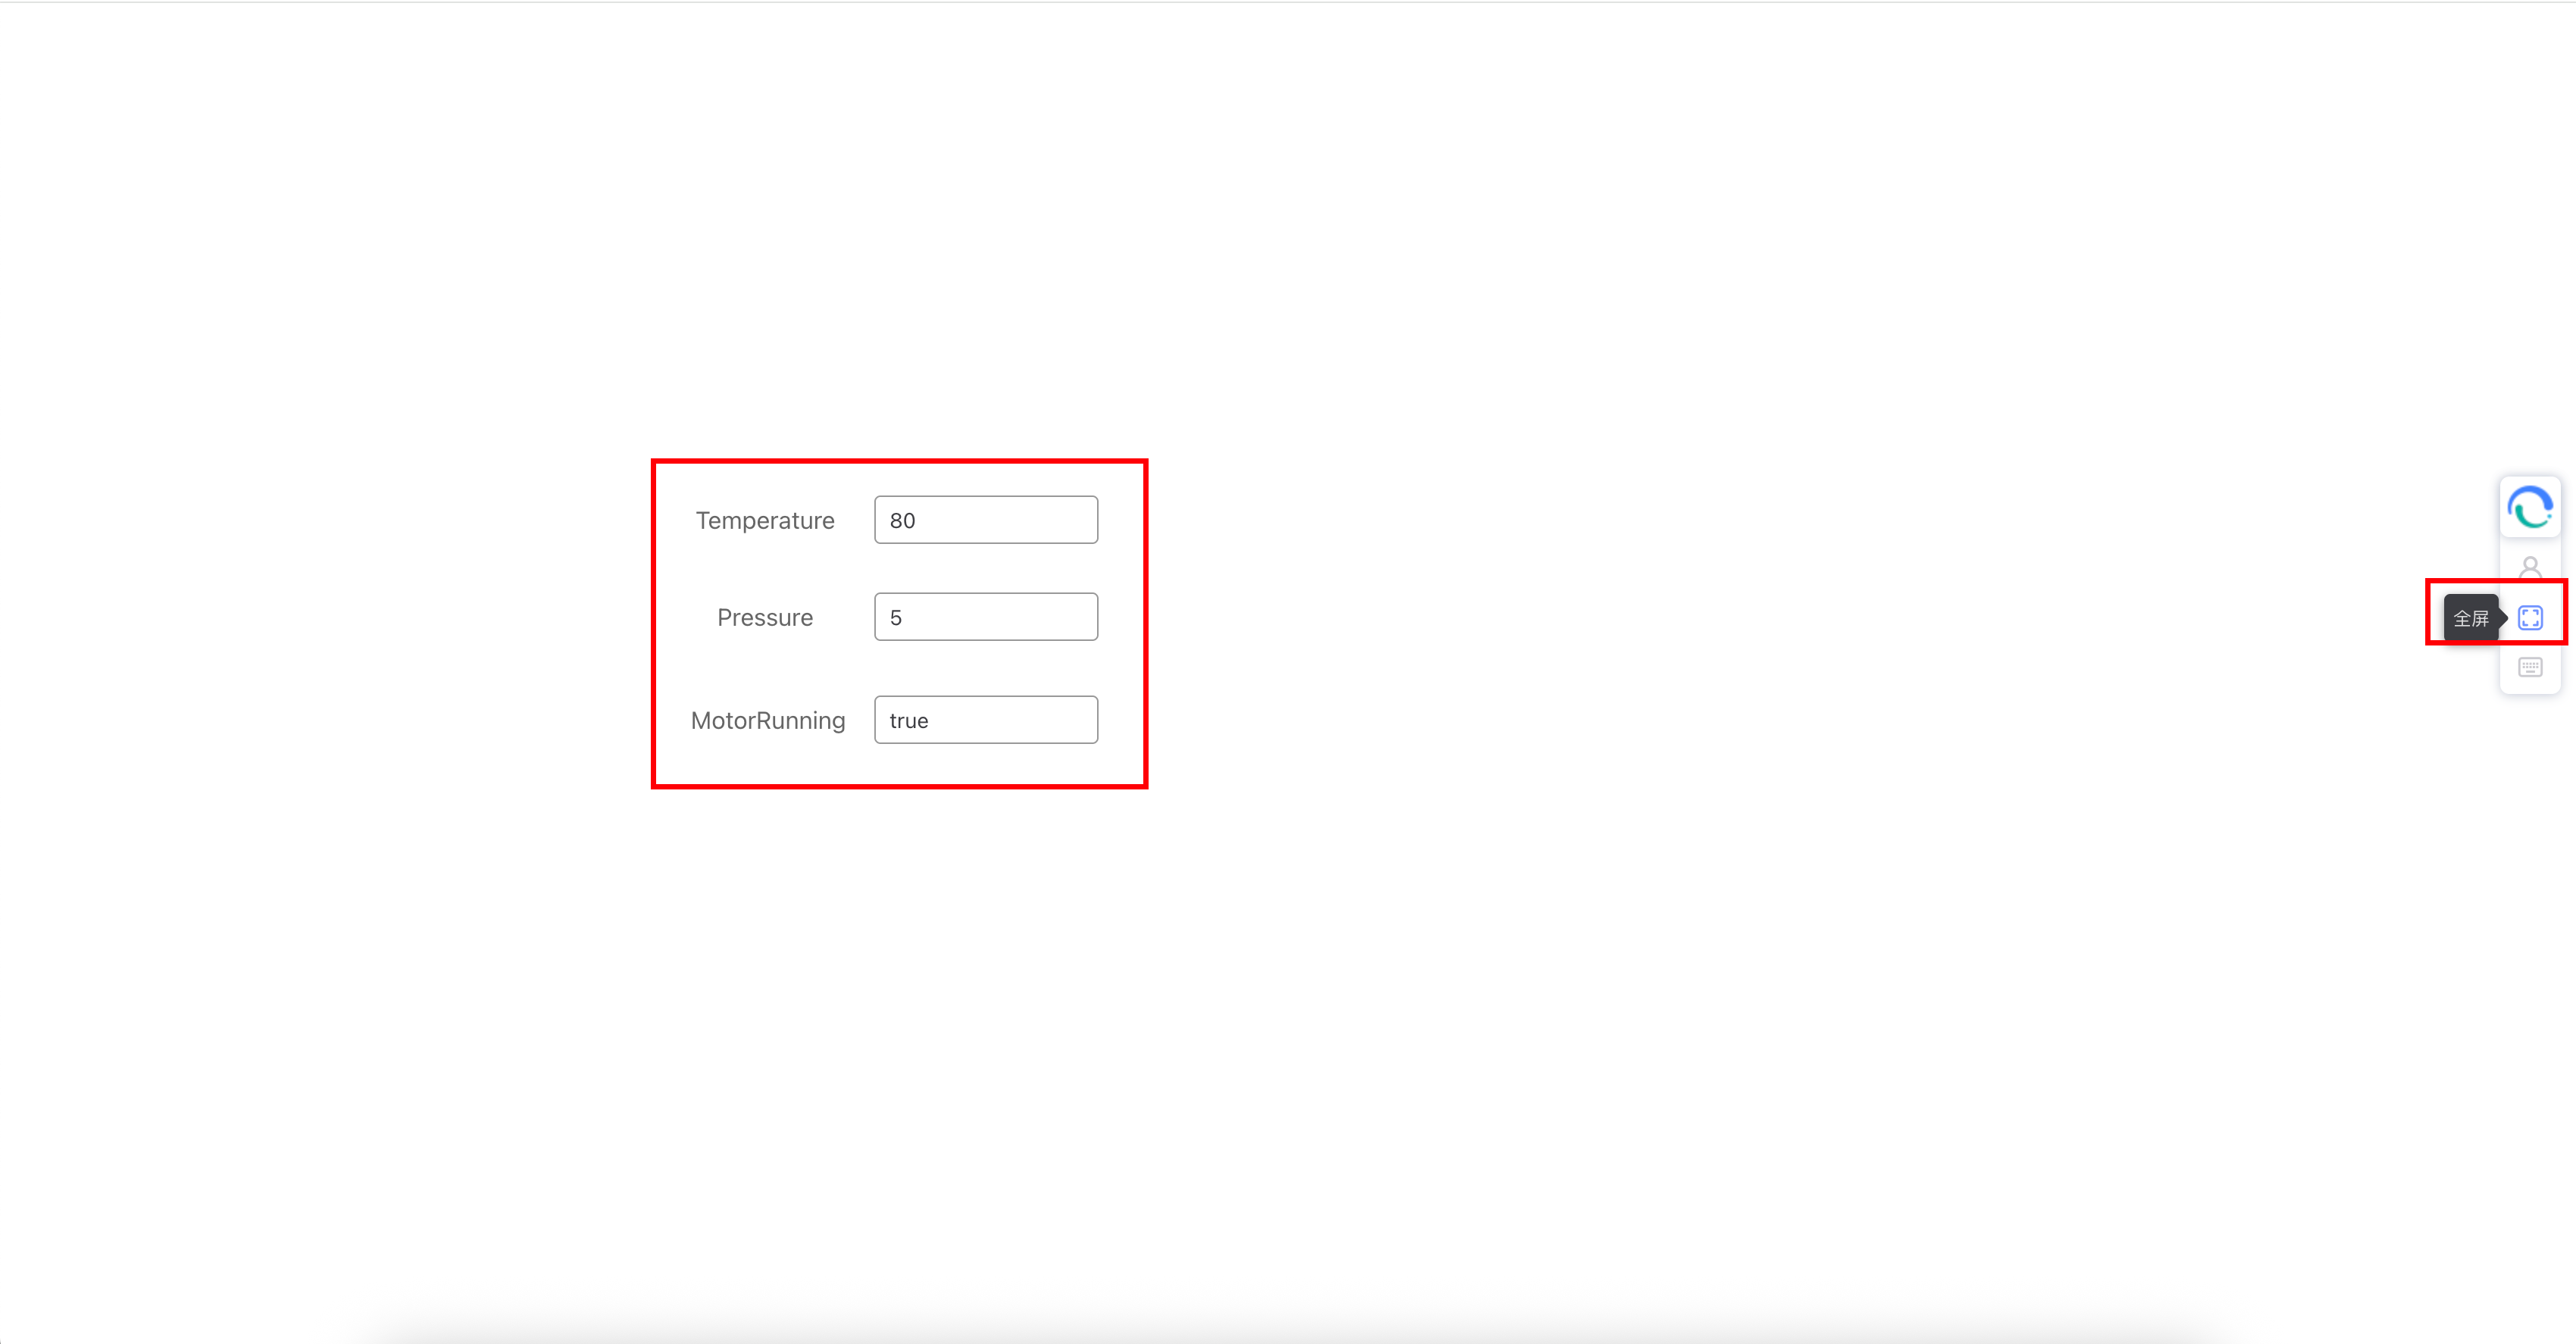
- Internal tags: manually change one test value and confirm the value updates
- Static Simulation: confirm that the external tags can be read or written even without a live PLC
Do not continue until one tag path works.
Example: external tags under Static Simulation can still be monitored and written during offline engineering.
Step 5: Create Your First Monitoring View
For day 1, use one of these options:
- AI-assisted: fastest way to get a usable layout
- manual: best way to learn the editor layout and binding process
Option A: Build the First View with AI
Open the view area and start the AI page workflow.
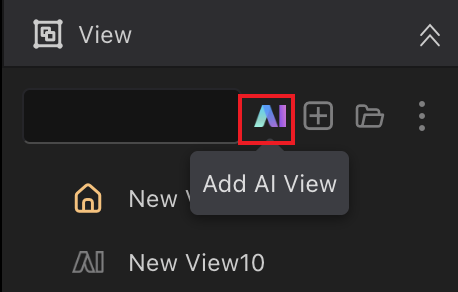
Path:
- View → AI View
Describe the screen. Keep it simple and specific.
Use a prompt pattern like this:
Create a monitoring page for [machine/line/process].
Show:
- current temperature
- current pressure
- motor running status
- one trend chart
- one alarm/status summary area
Use a clean industrial layout for operators.
Examples by scenario:
Create a monitoring page for a packaging machine with speed, product count, machine state, and alarm summary.
Create a monitoring page for a pump skid with inlet pressure, outlet pressure, temperature, motor state, and trend chart.
Create a monitoring page for a furnace with zone temperatures, pressure, running state, and a 1-hour trend.
Review the result before saving. AI gives you the first draft. You still need engineering review.
Option B: Create a Basic View Manually
If you want to learn the editor directly, create a blank view first.
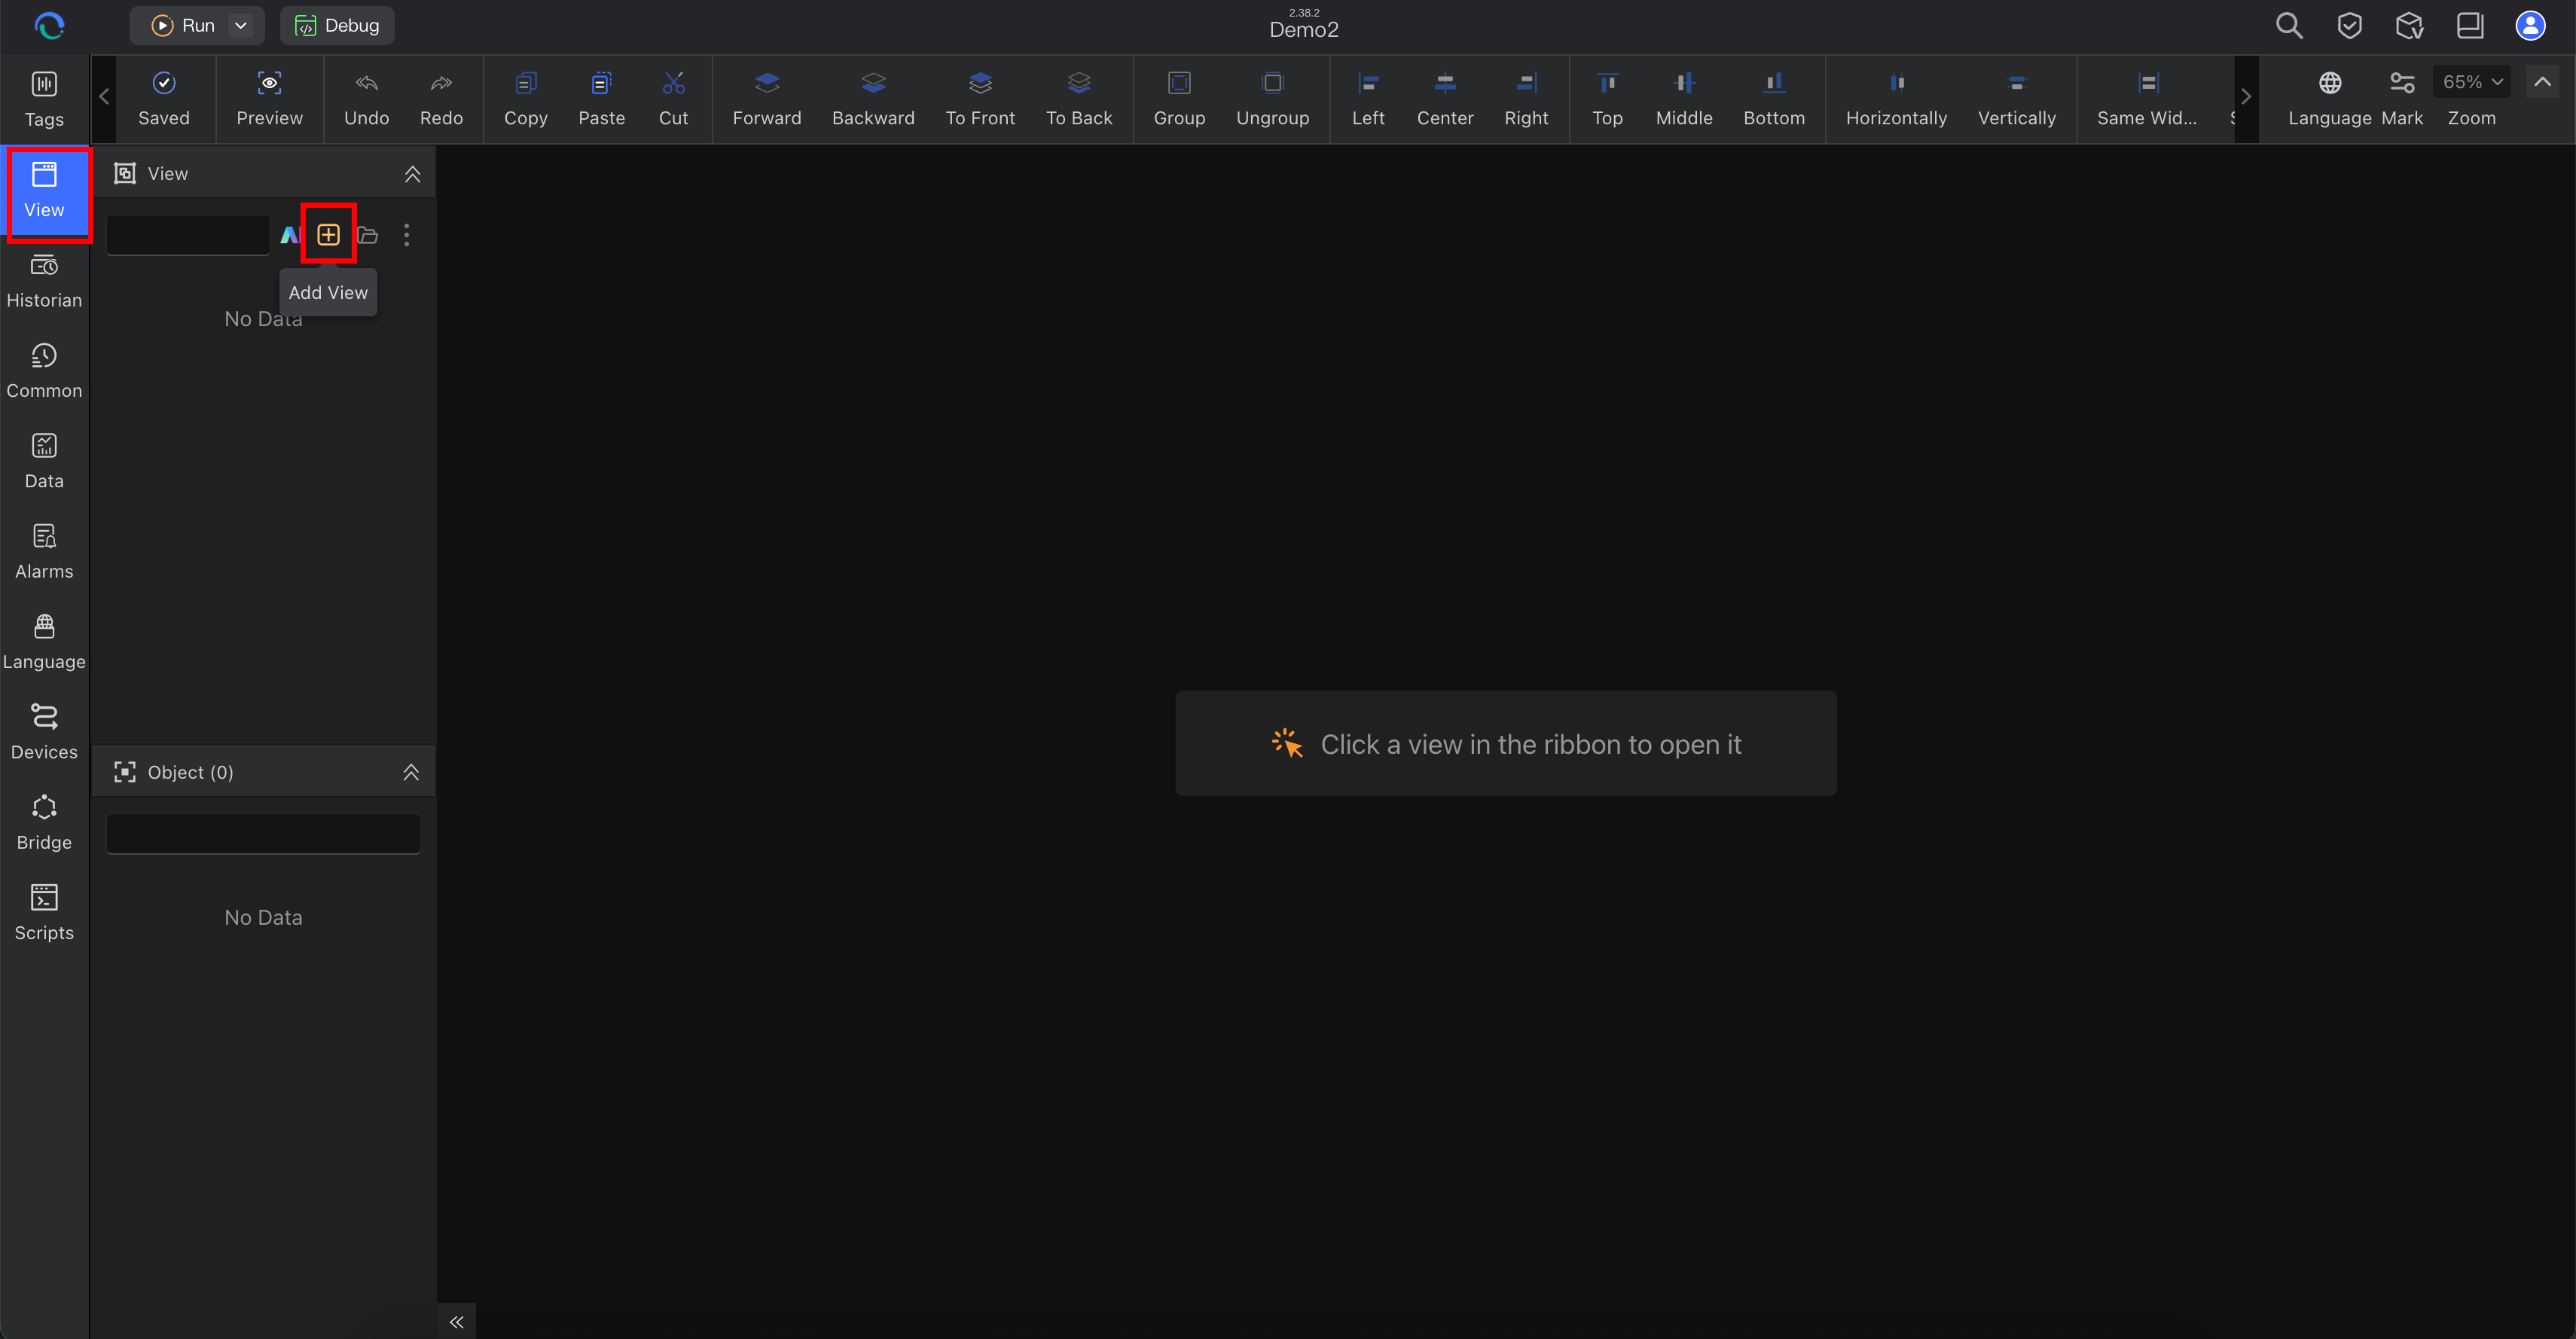
Then open the new blank view.
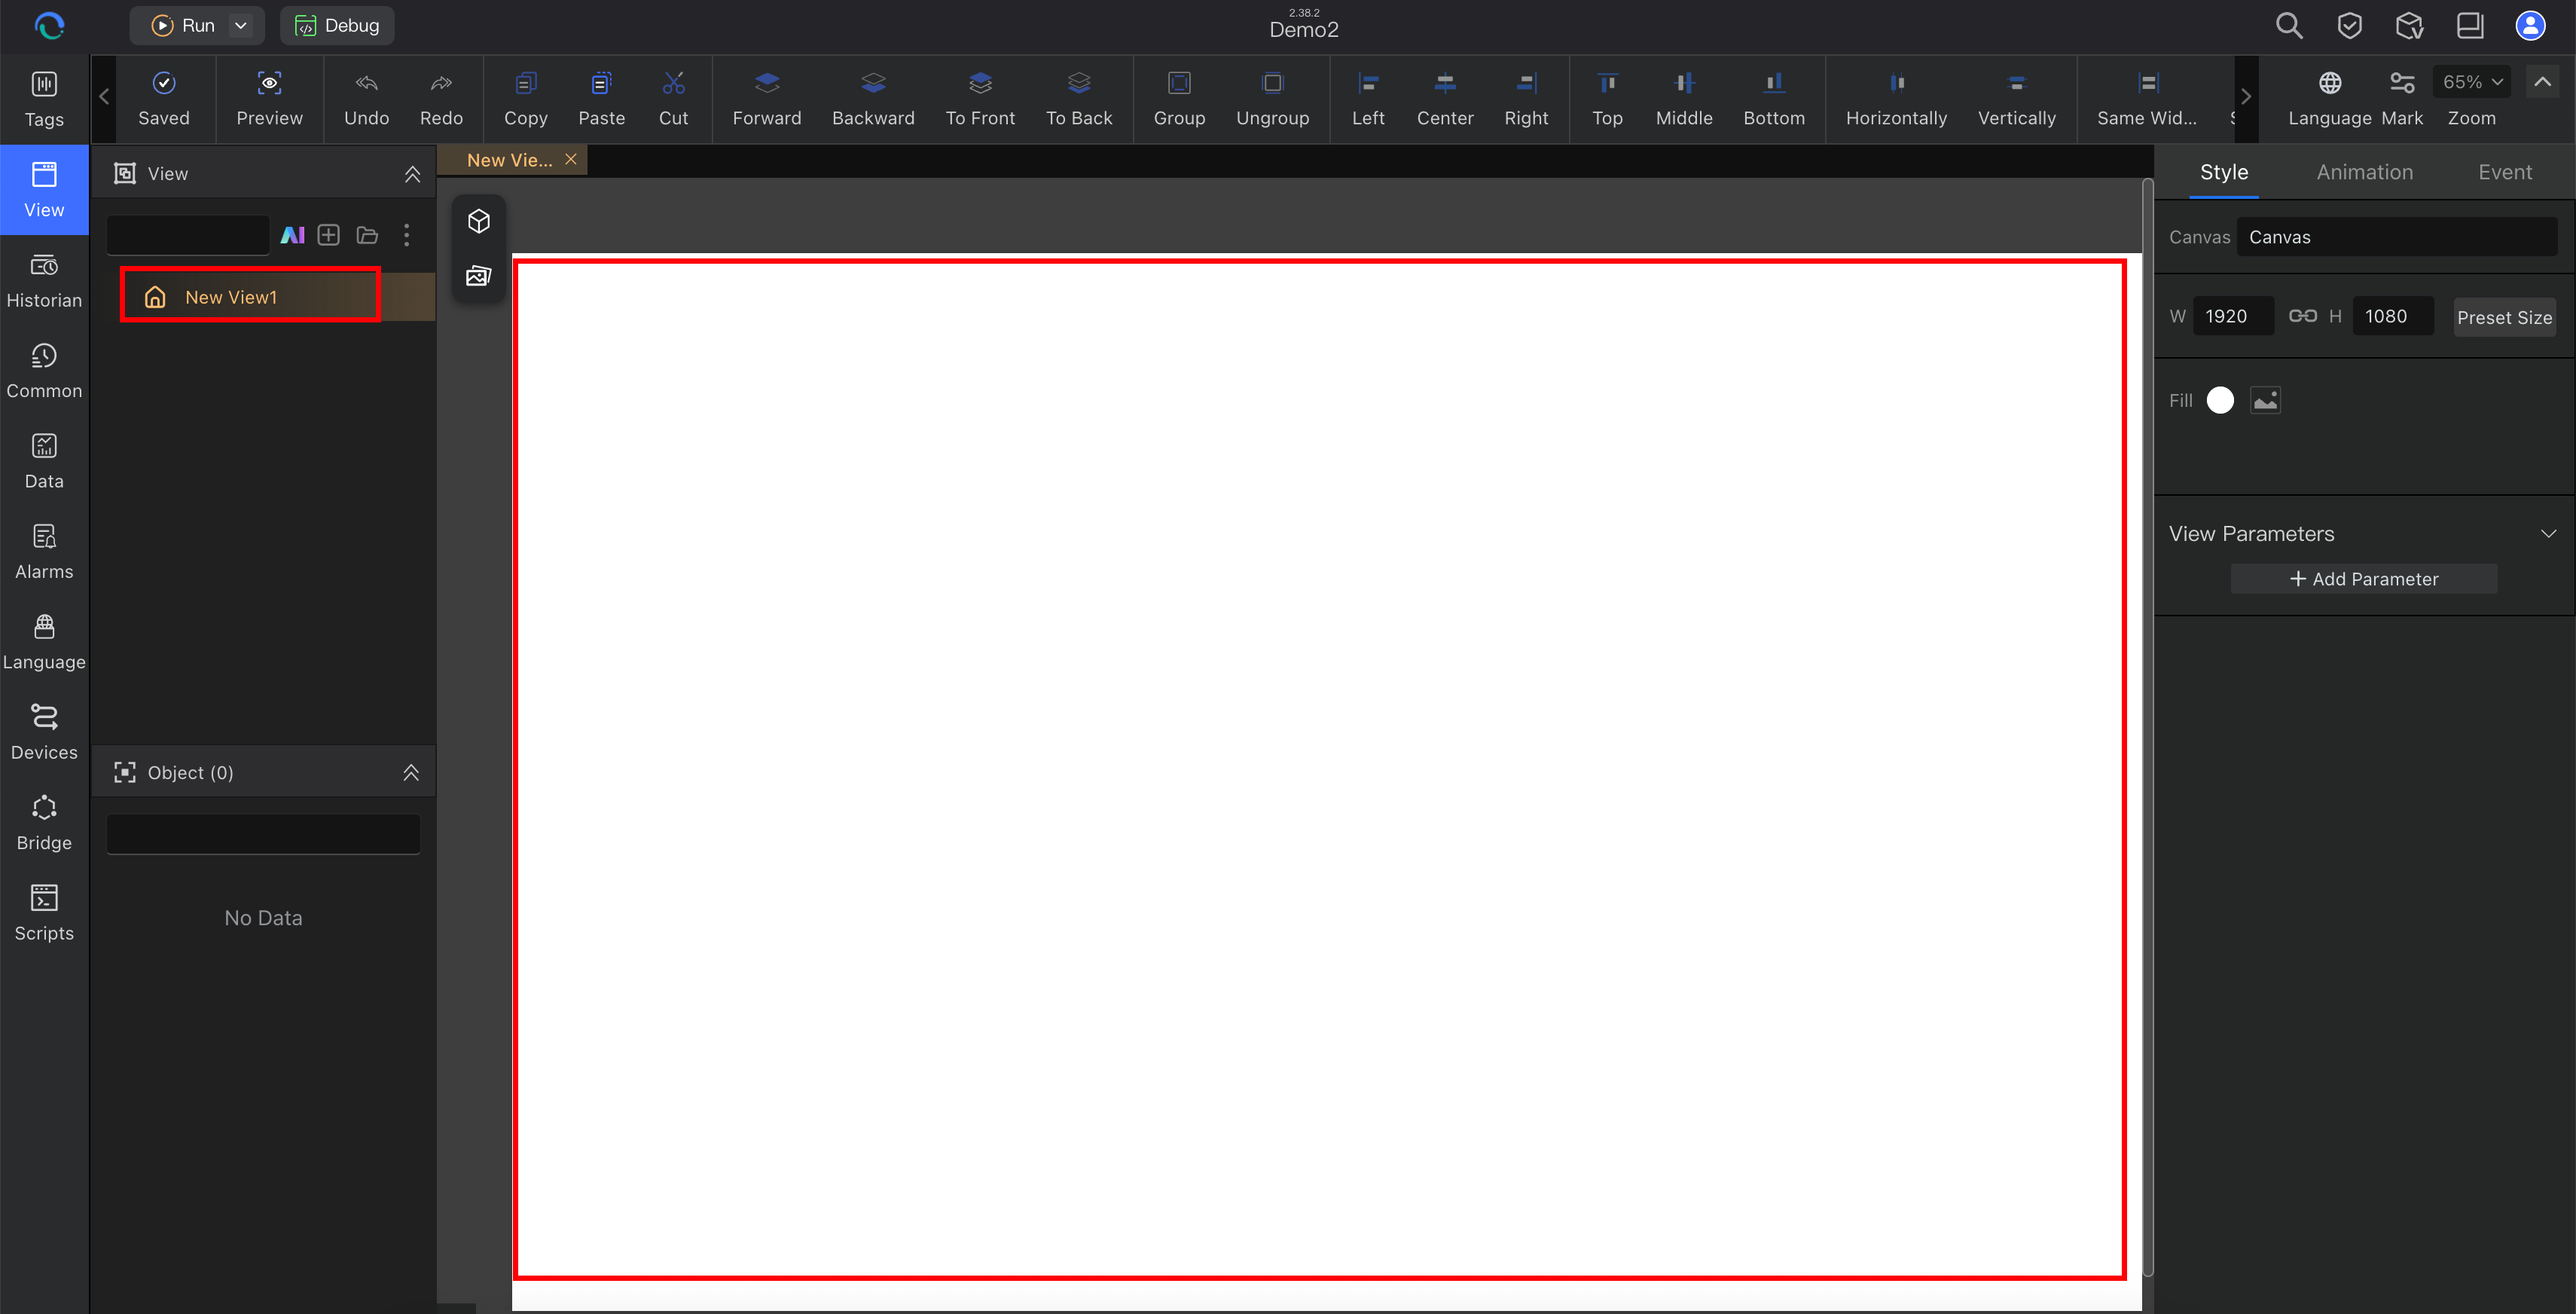
Use the view area to:
- click the new view action in the View panel
- give the view a clear name such as
Overview,Station1, orPumpSkid - place a few basic components
- keep the first screen simple
Start with:
- one numeric value for
Temperature - one numeric value for
Pressure - one status indicator for
MotorRunning - one chart or trend area to extend later
You can start by dropping a simple read/write field onto the canvas.
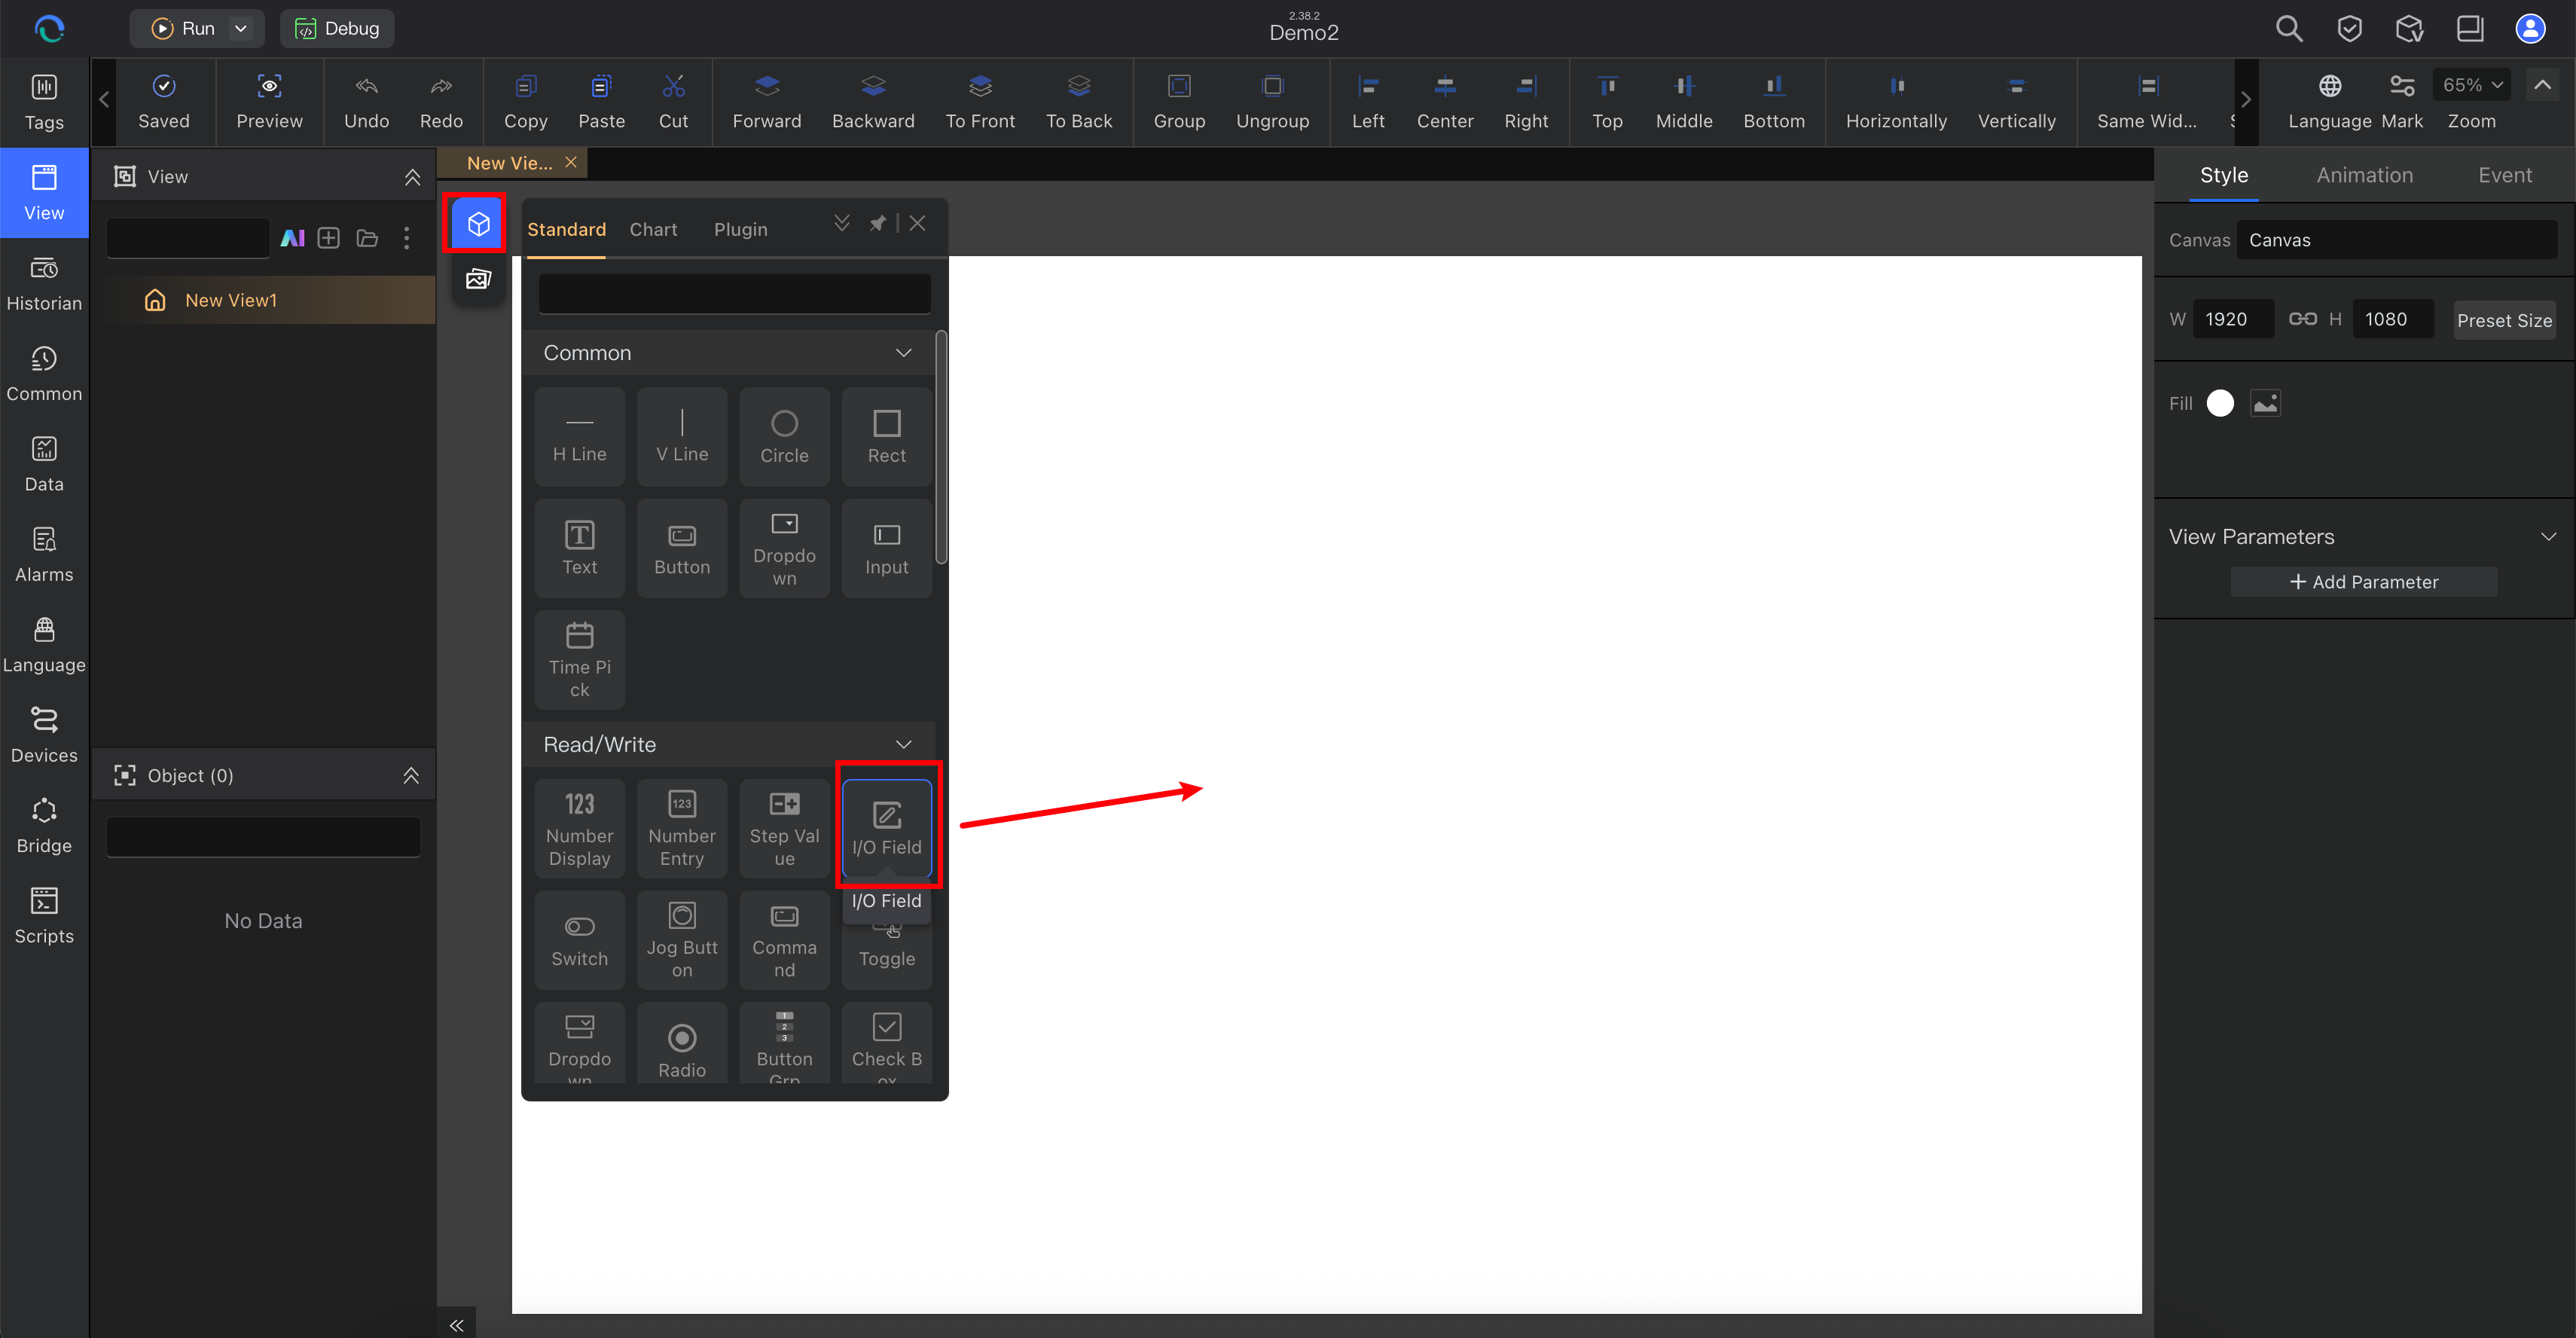
After you place the component, review its basic properties on the right side.
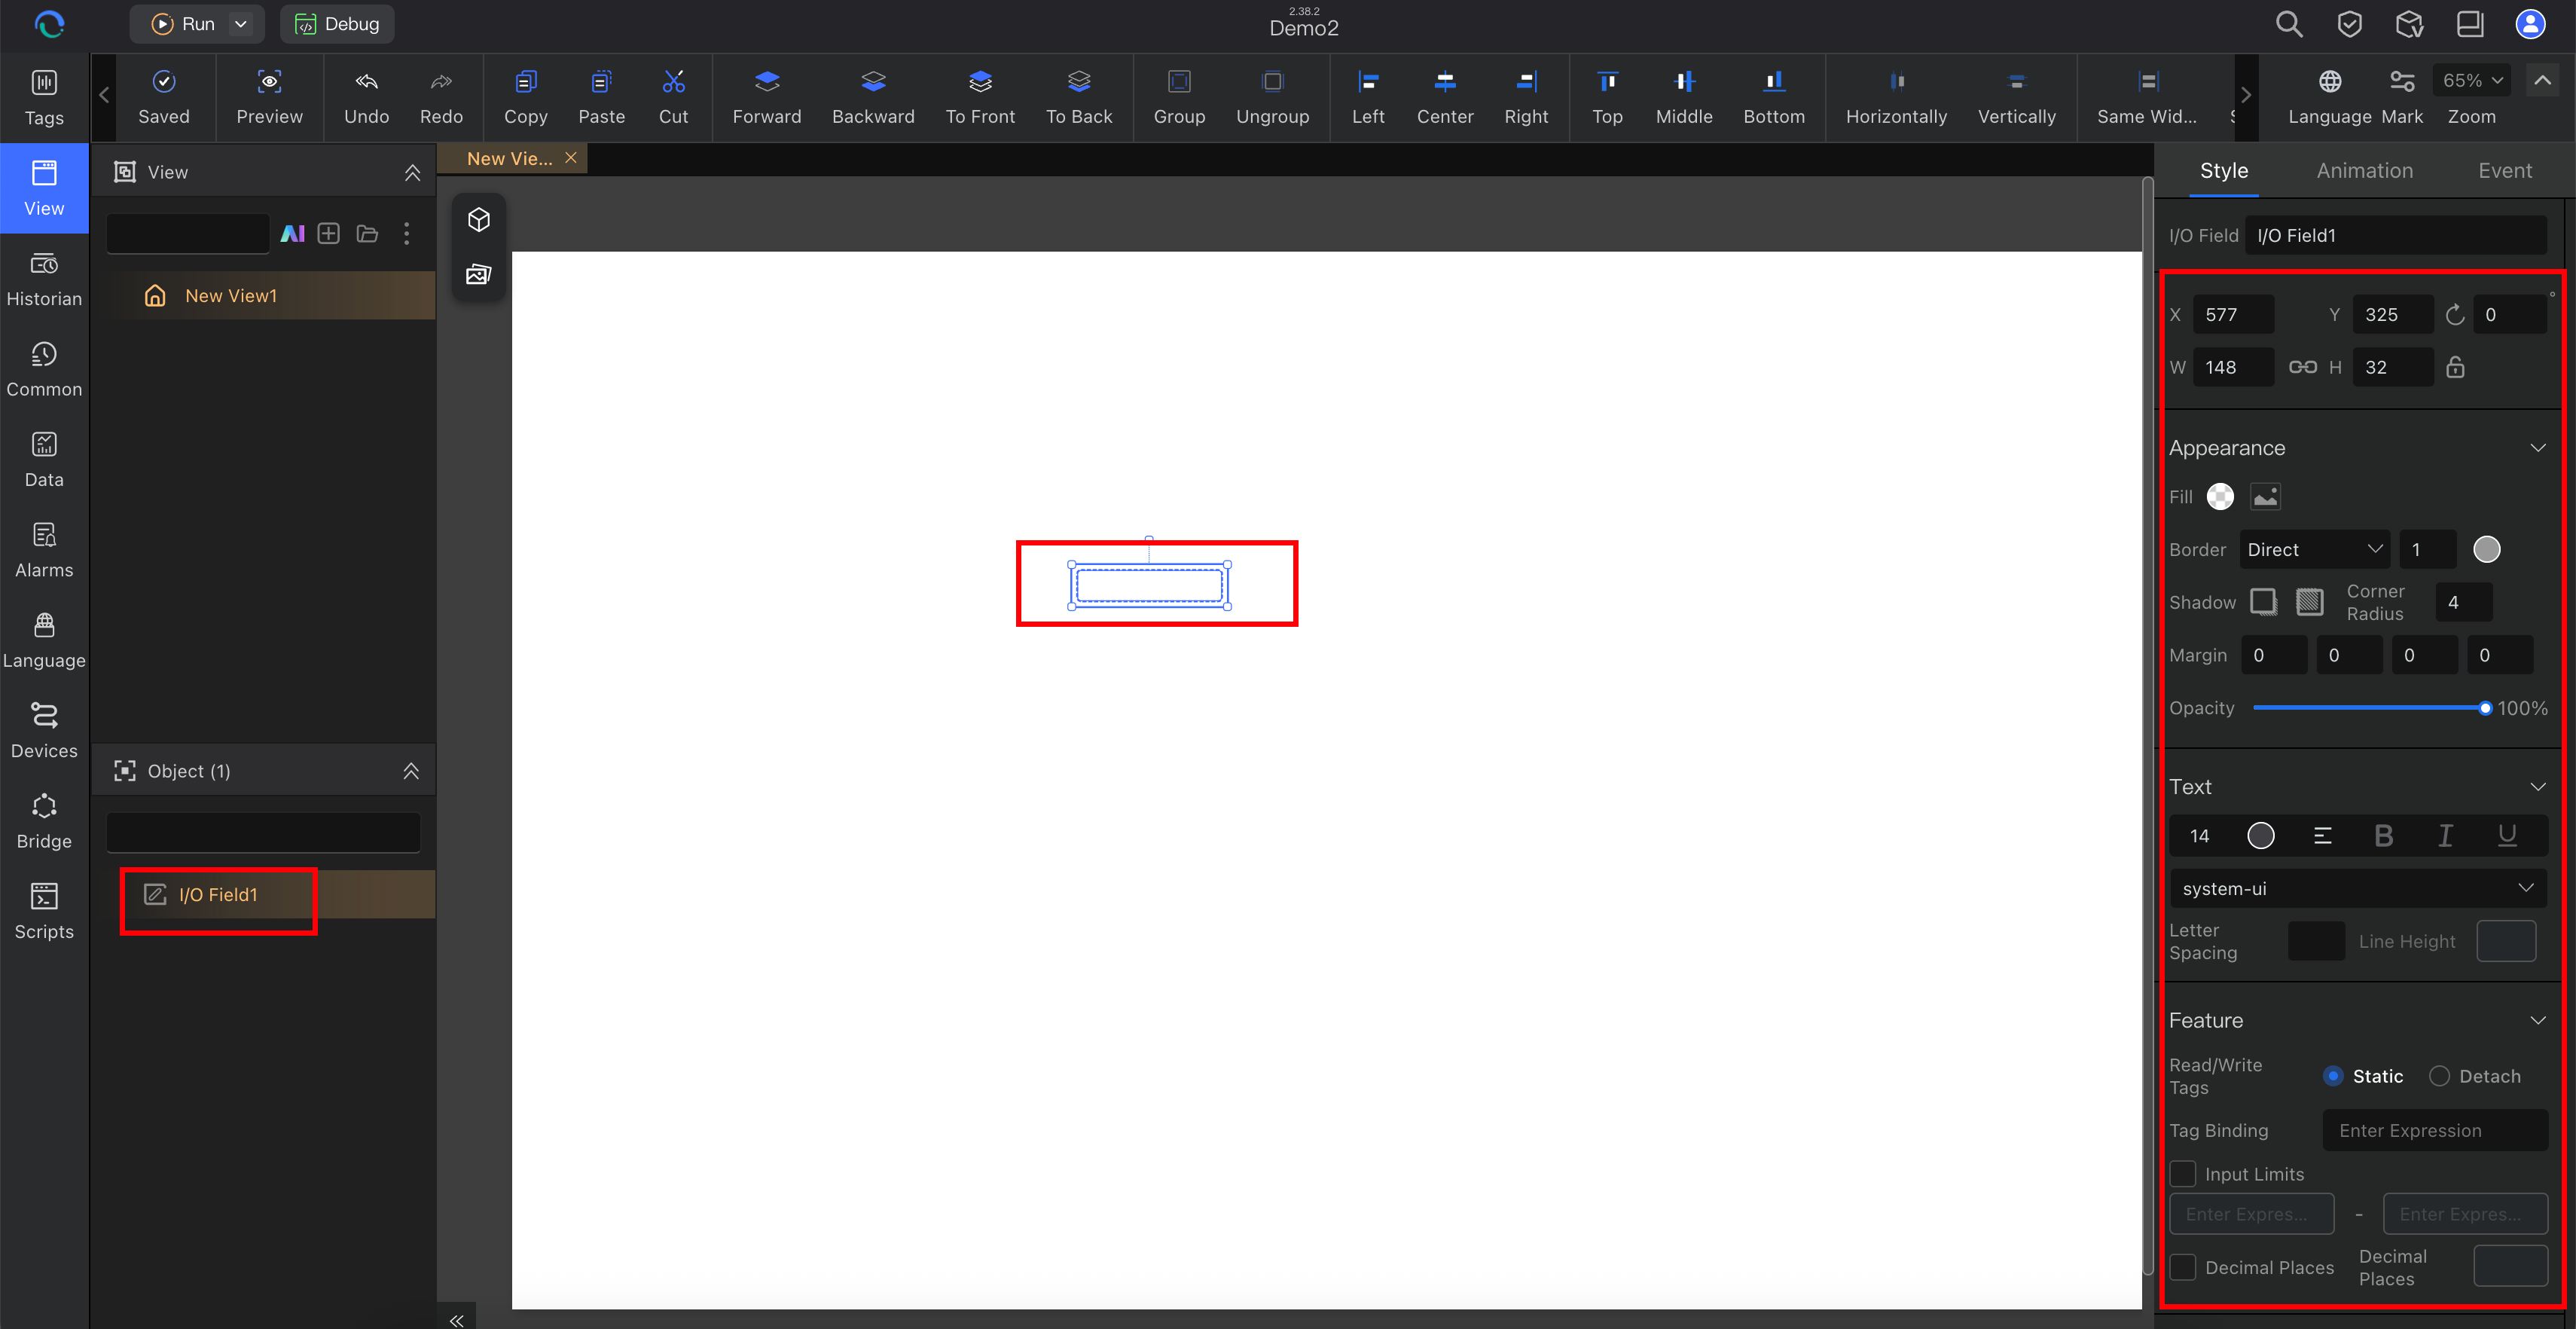
If you need the editor layout, see Understanding Views.
Step 6: Bind Tags to the View
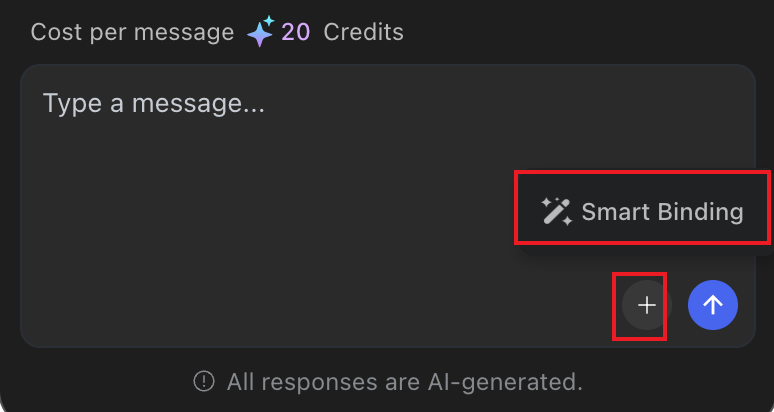
AI Smart Binding
If you created the screen with AI, run Smart Binding next.
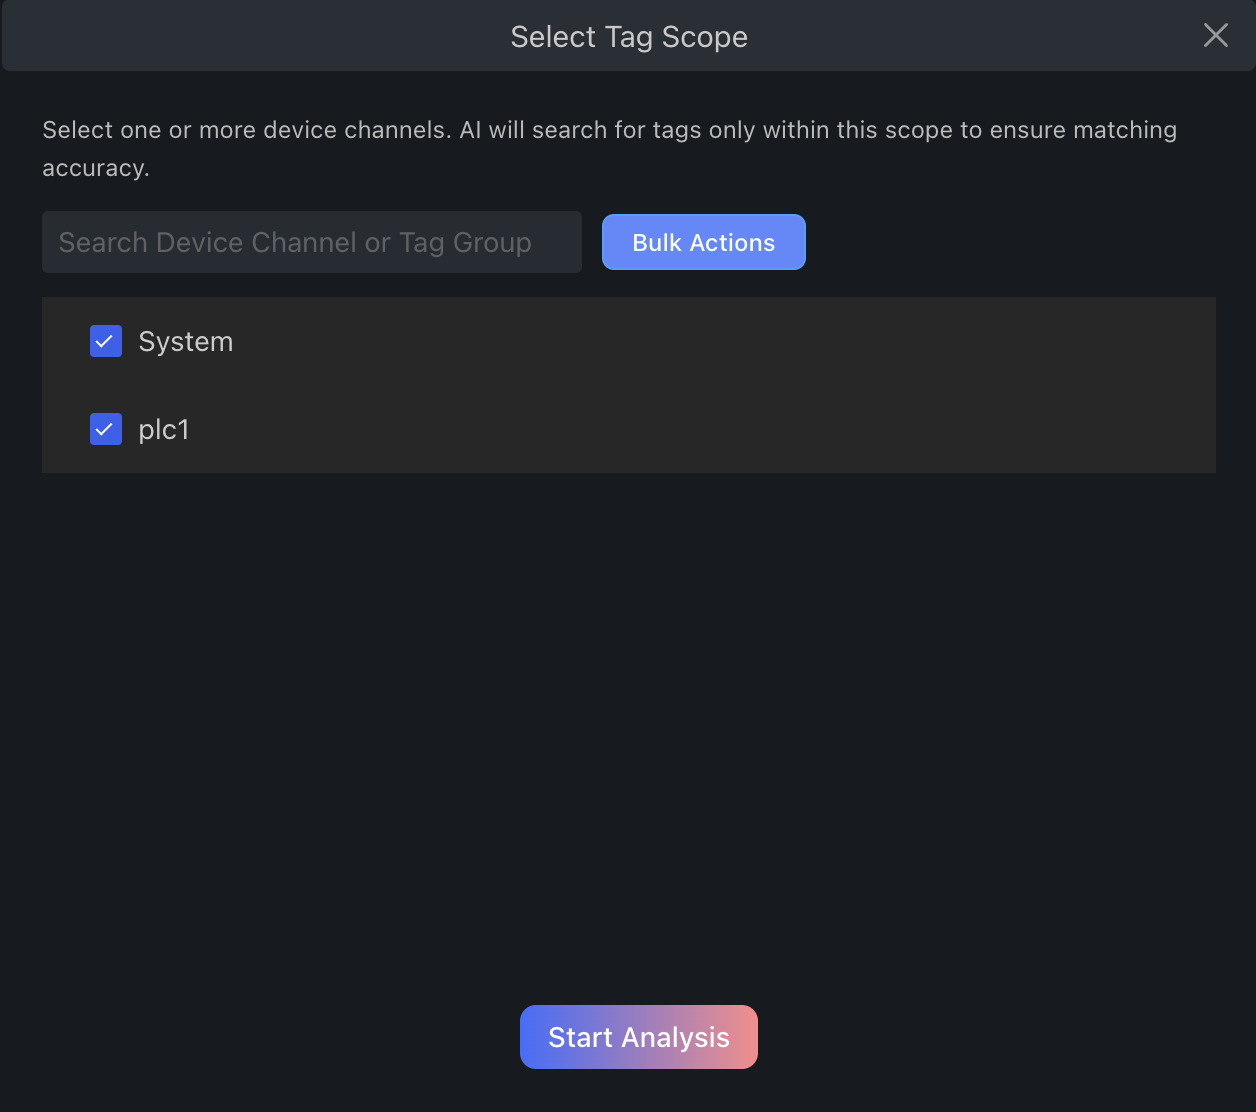
Then select the channel or tag scope you want AI to analyze.
Review the proposed matches carefully.
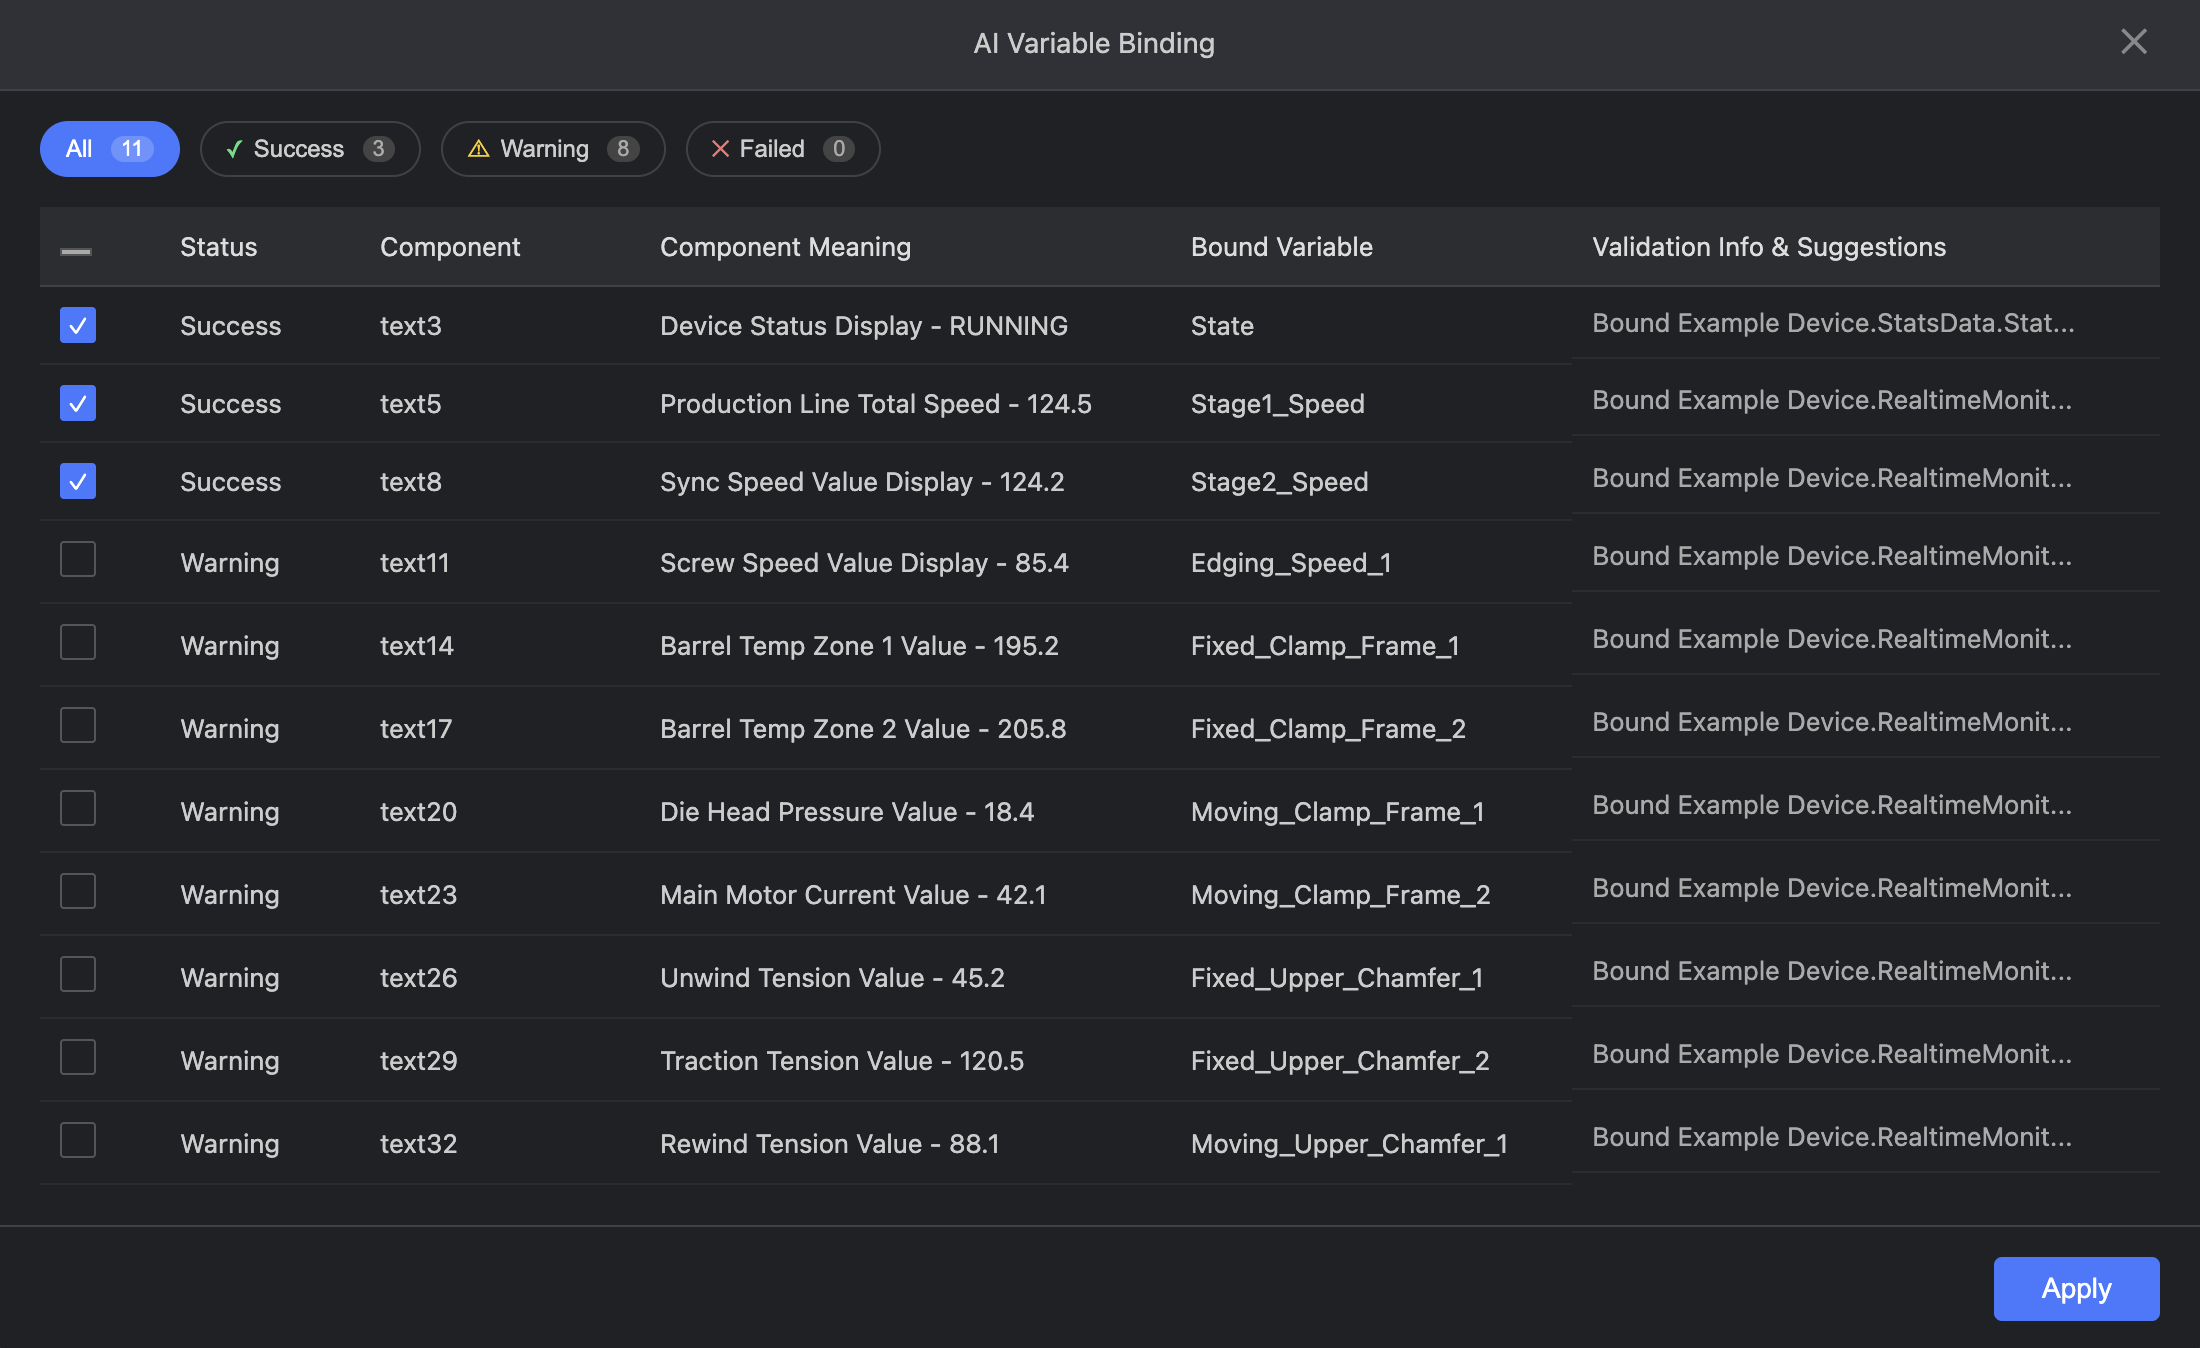
What to check:
- component meaning matches the bound variable
- important values are marked as success
- warnings are reviewed before you click Apply
Manual Tag Binding
Even if you use AI, some components may still need manual adjustment.
Use manual binding when:
- the generated label does not match your real tag name
- the screen uses customer-specific naming
- you want tighter control over which tag goes to which component
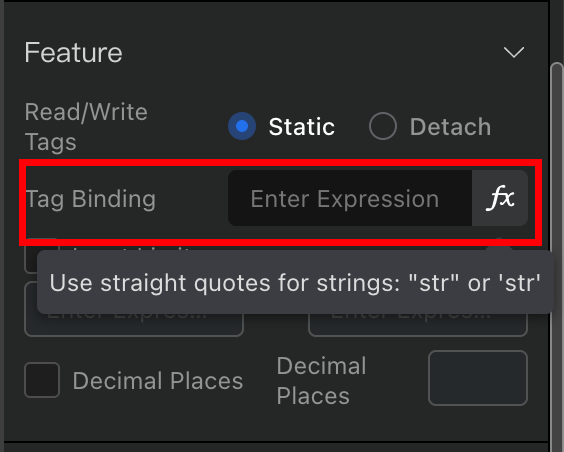
Manual binding path:
- select a component on the canvas
- open the property panel on the right side
- find the value, tag, or binding field
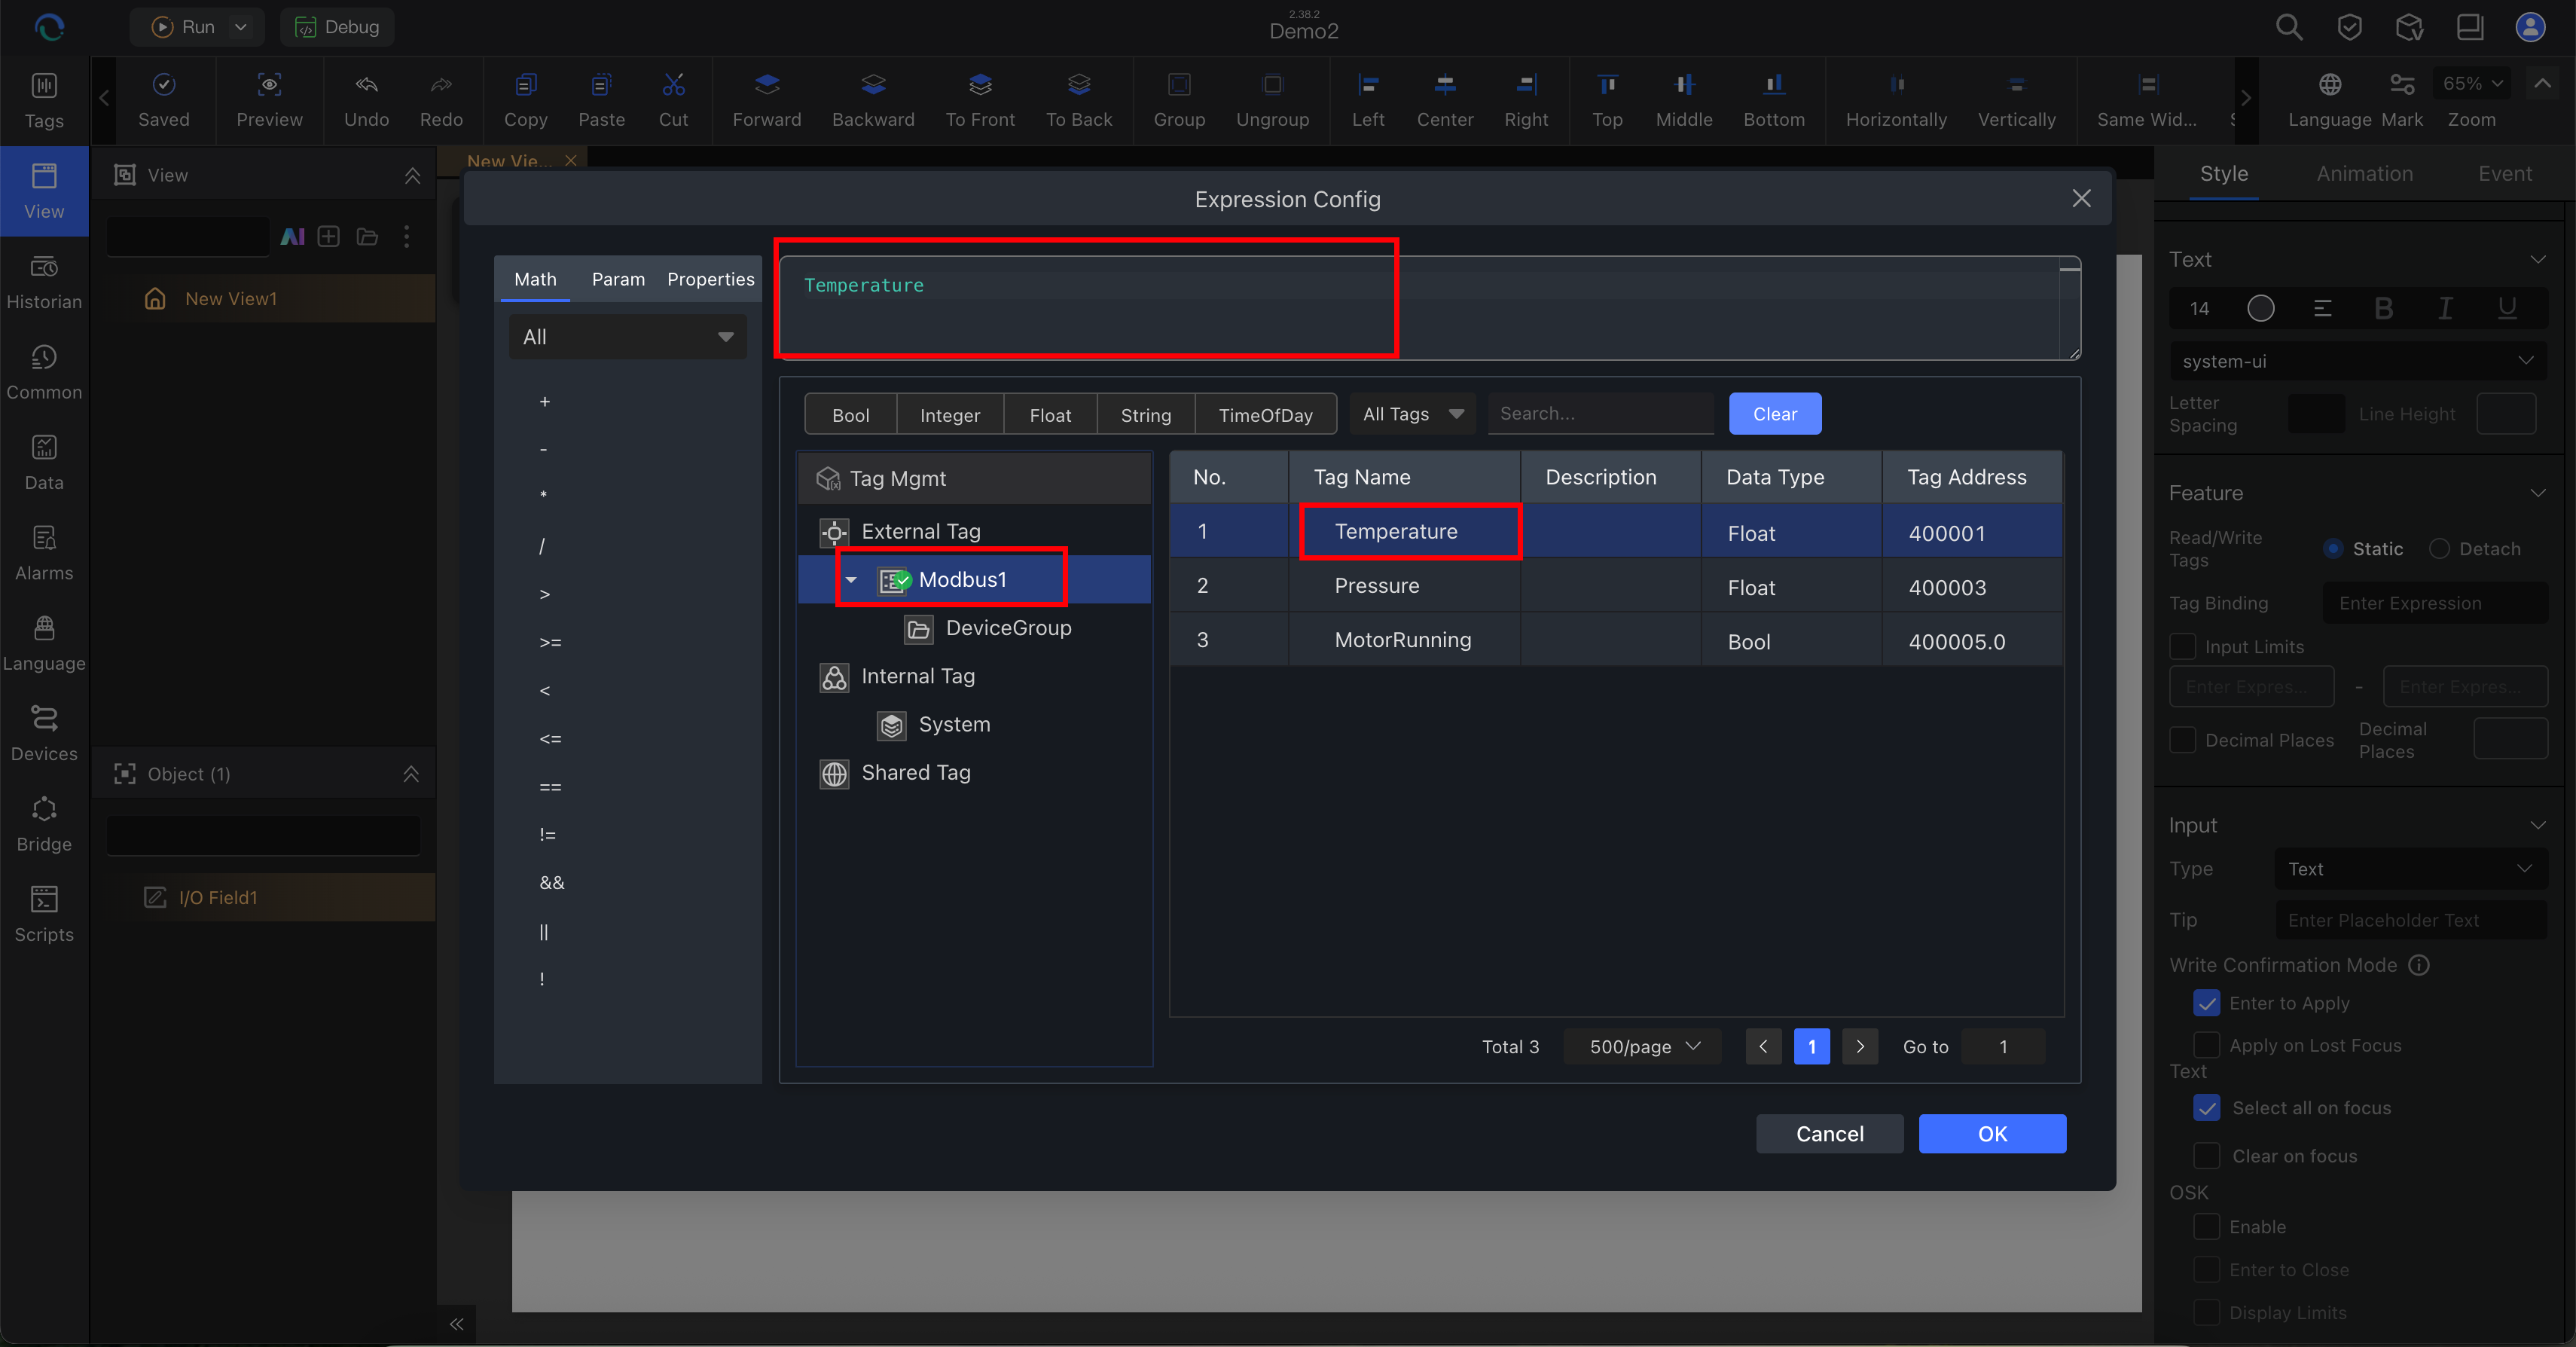
- bind it to
Temperature,Pressure,MotorRunning, or your own customer tag
Example: open the expression editor and bind the component to Temperature.
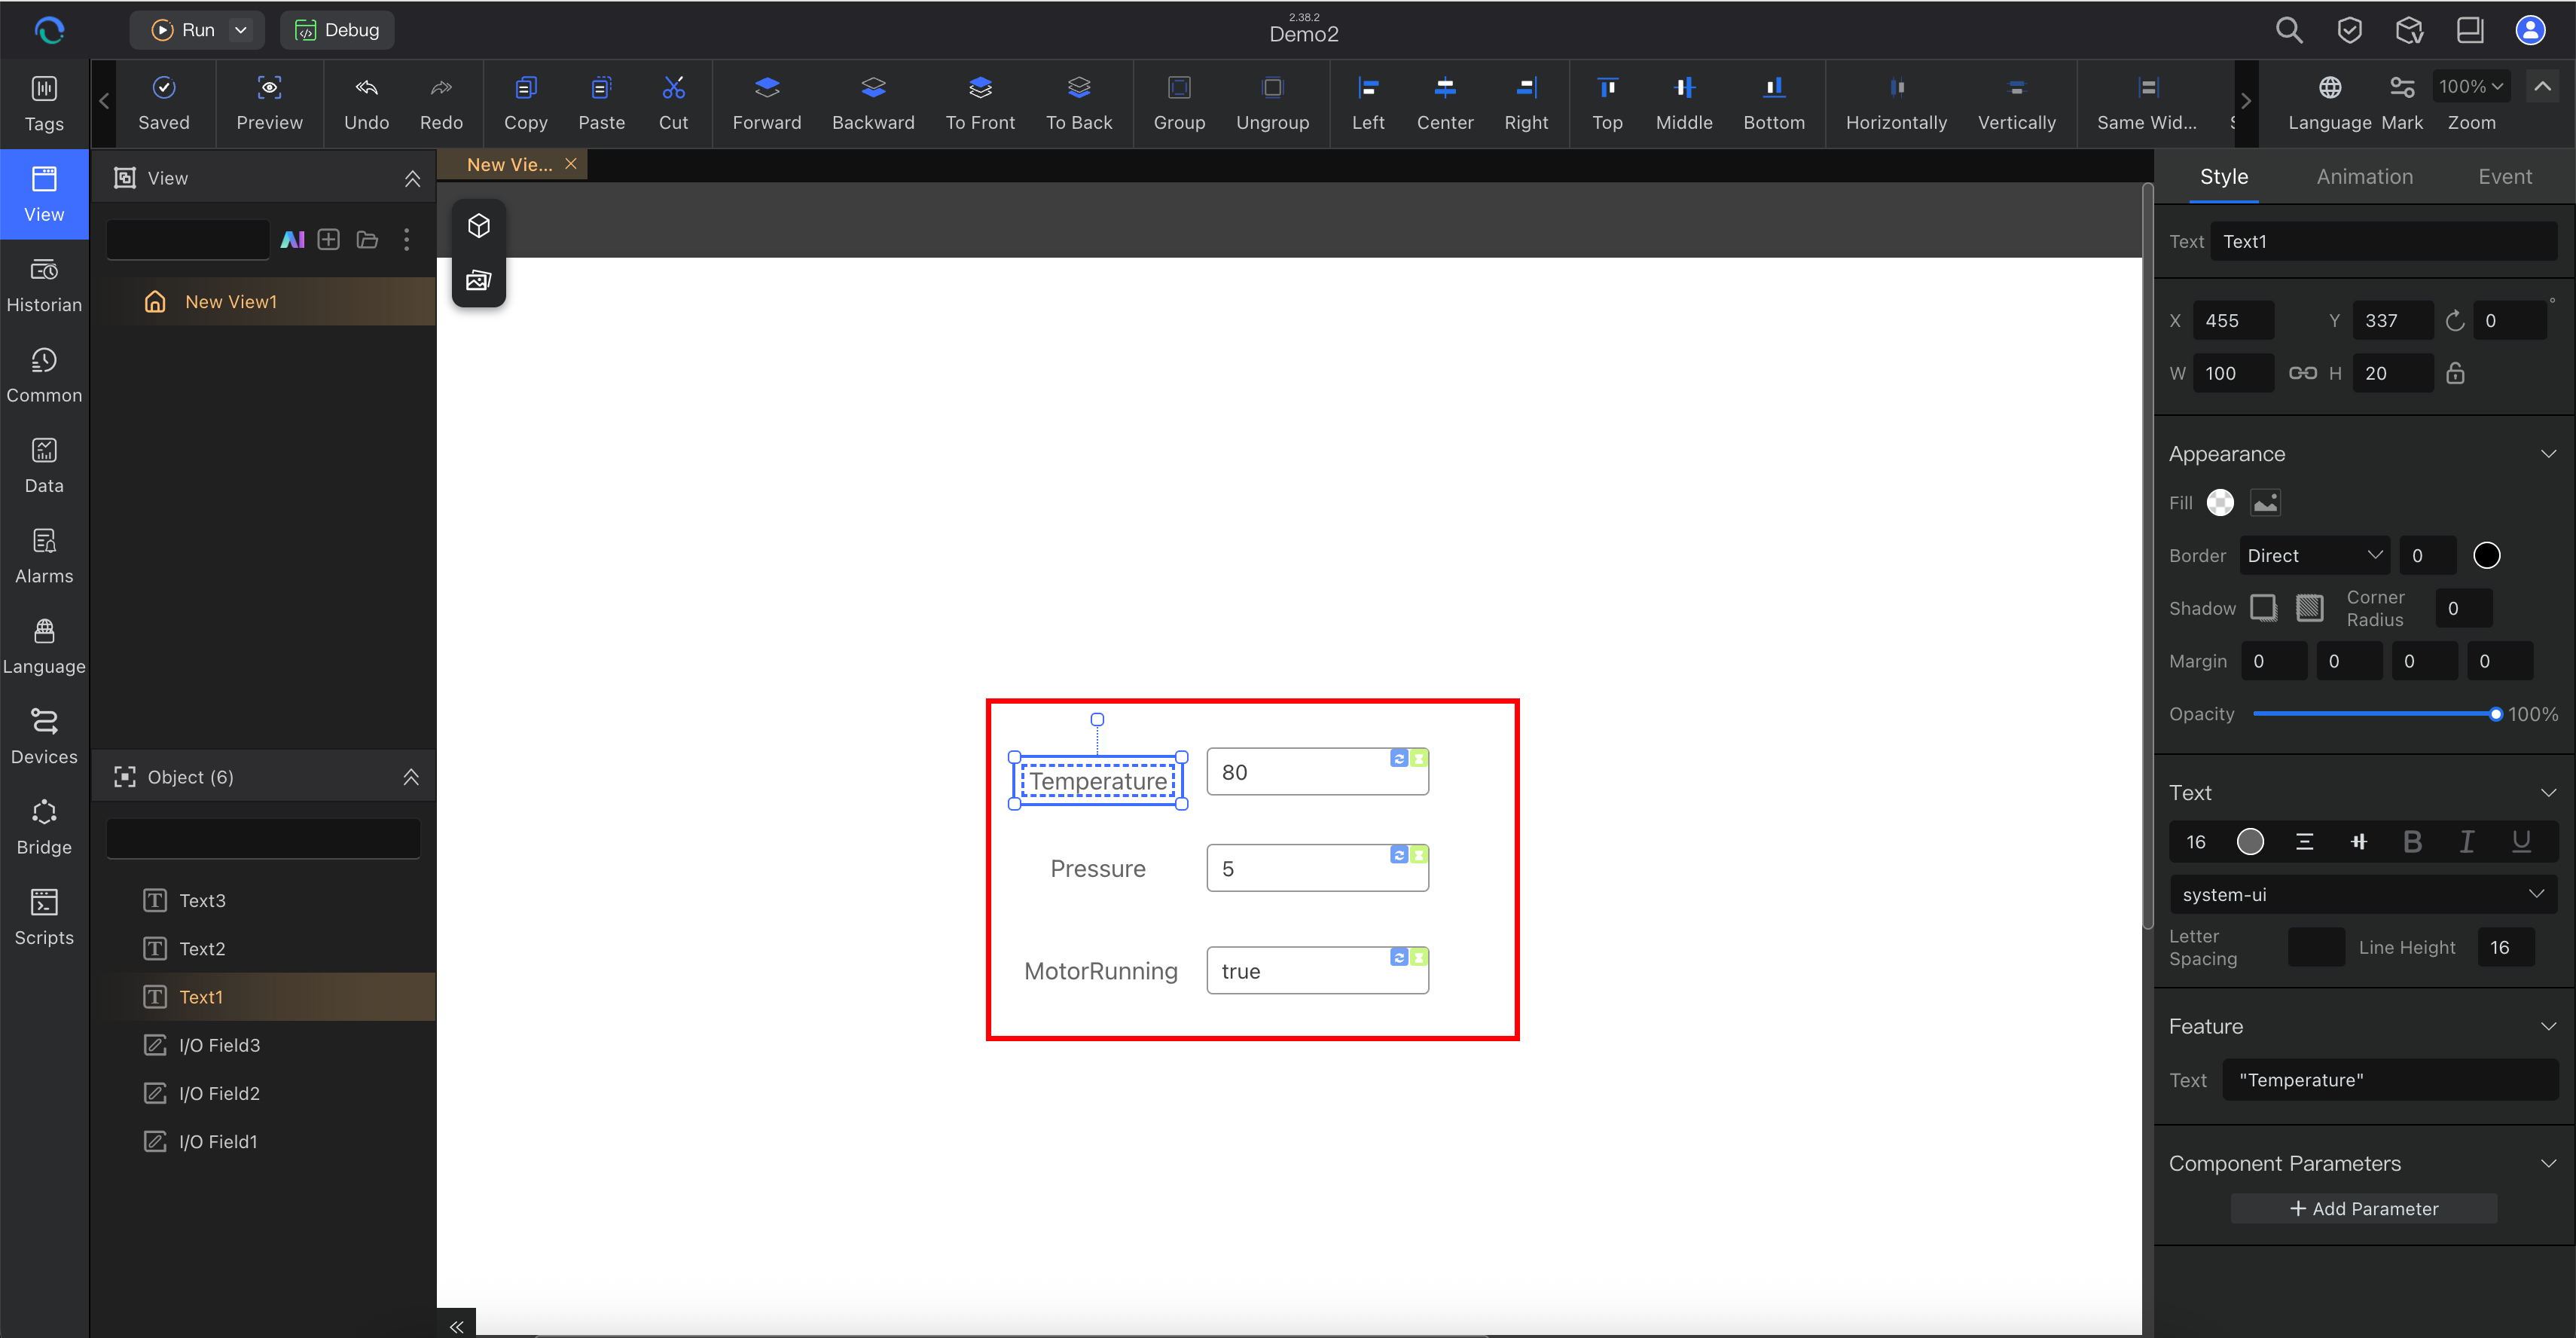
After a few bindings, the page should show a simple working layout.
Use this rule:
- use AI to speed up the first draft
- use manual review to make it correct
Step 7: Run the Project
Click Run in the top toolbar.
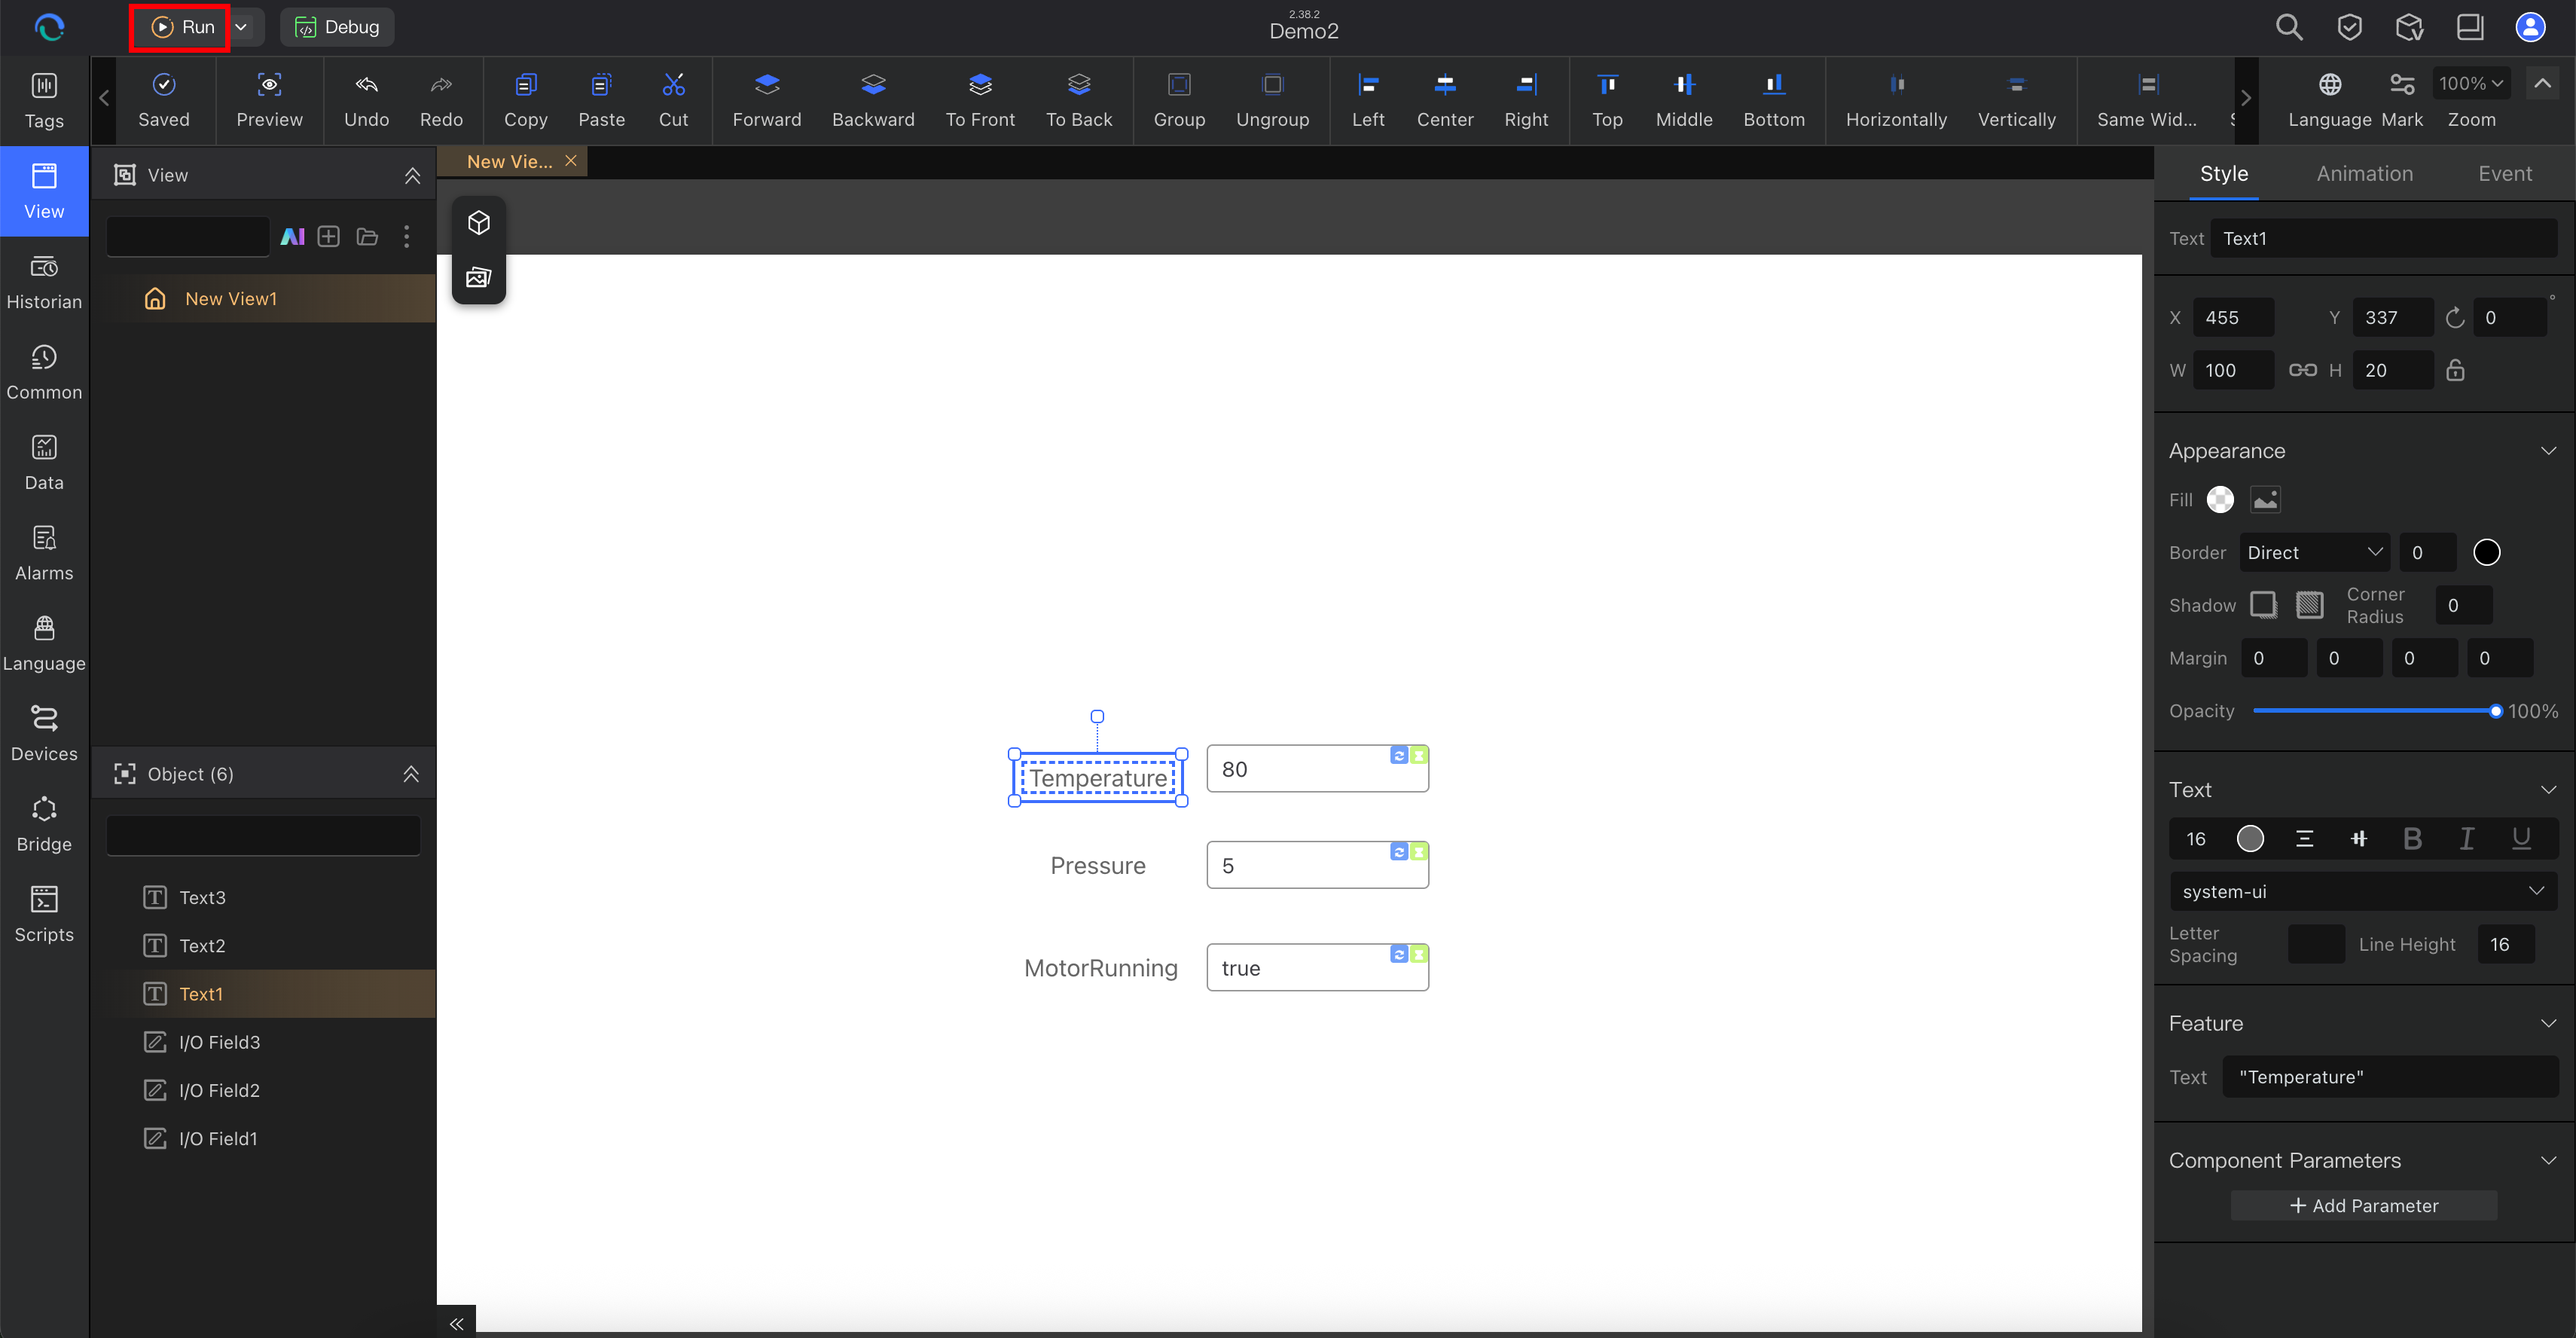
Depending on your setup, you may need to confirm runtime options or start services first.
For a normal first runtime:
- click Run
- review the runtime settings page
- start required services if prompted
- click Start Vision or the equivalent runtime start action
- wait for the runtime window or page to open
Do not stop at the runtime settings page. A successful run means the runtime display opens.
Step 8: Verify the Result
When runtime opens, you should see a working monitoring page.
Verify these items:
- the view opens in runtime
- bound tag values are visible
- status indicators render correctly
- navigation and basic interaction work
- if you change an internal or simulated tag during debugging, the runtime view responds as expected
If you used internal tags or Static Simulation, the project is still valid. Replace the simulated setup later without redesigning the workflow.
Optional Step 9: Record Business Data in a Data Table
Use Data Management when you need row-based business records, not only live tags or historian trends.
Typical examples:
- one row for each completed part
- one row for each state change
- one row for each shift summary
- one row for each alarm-related snapshot
Do this:
- open Data Management
- click Add → Tag Archiving
- create a table such as
Cycle_Records,Shift_Output, orAlarm_Snapshots - keep the default
Record Timefield and add fields such asProductCode,Temperature,Pressure, andResult - link each field to a tag or define it with a formula
- set a trigger rule such as part complete, state change, alarm event, or every minute
- open Run Settings and start the Data Service
- open a view and bind a Table component or a Chart component to this data table; for charts, choose a dimension field and a metric field
Result:
- the runtime records business events as rows
- views can use the table directly for dashboard-style visualization
Use this only after the main tag-view-run path is already working.
Optional Day-1 Extensions
These are useful after your first successful run:
- Historian for trend and time-series storage: Configuring Historian
- Data Management for business tables, trigger-based records, and chart-driven dashboards: Understanding Data Management
- Alarm setup for abnormal conditions: Creating Alarms
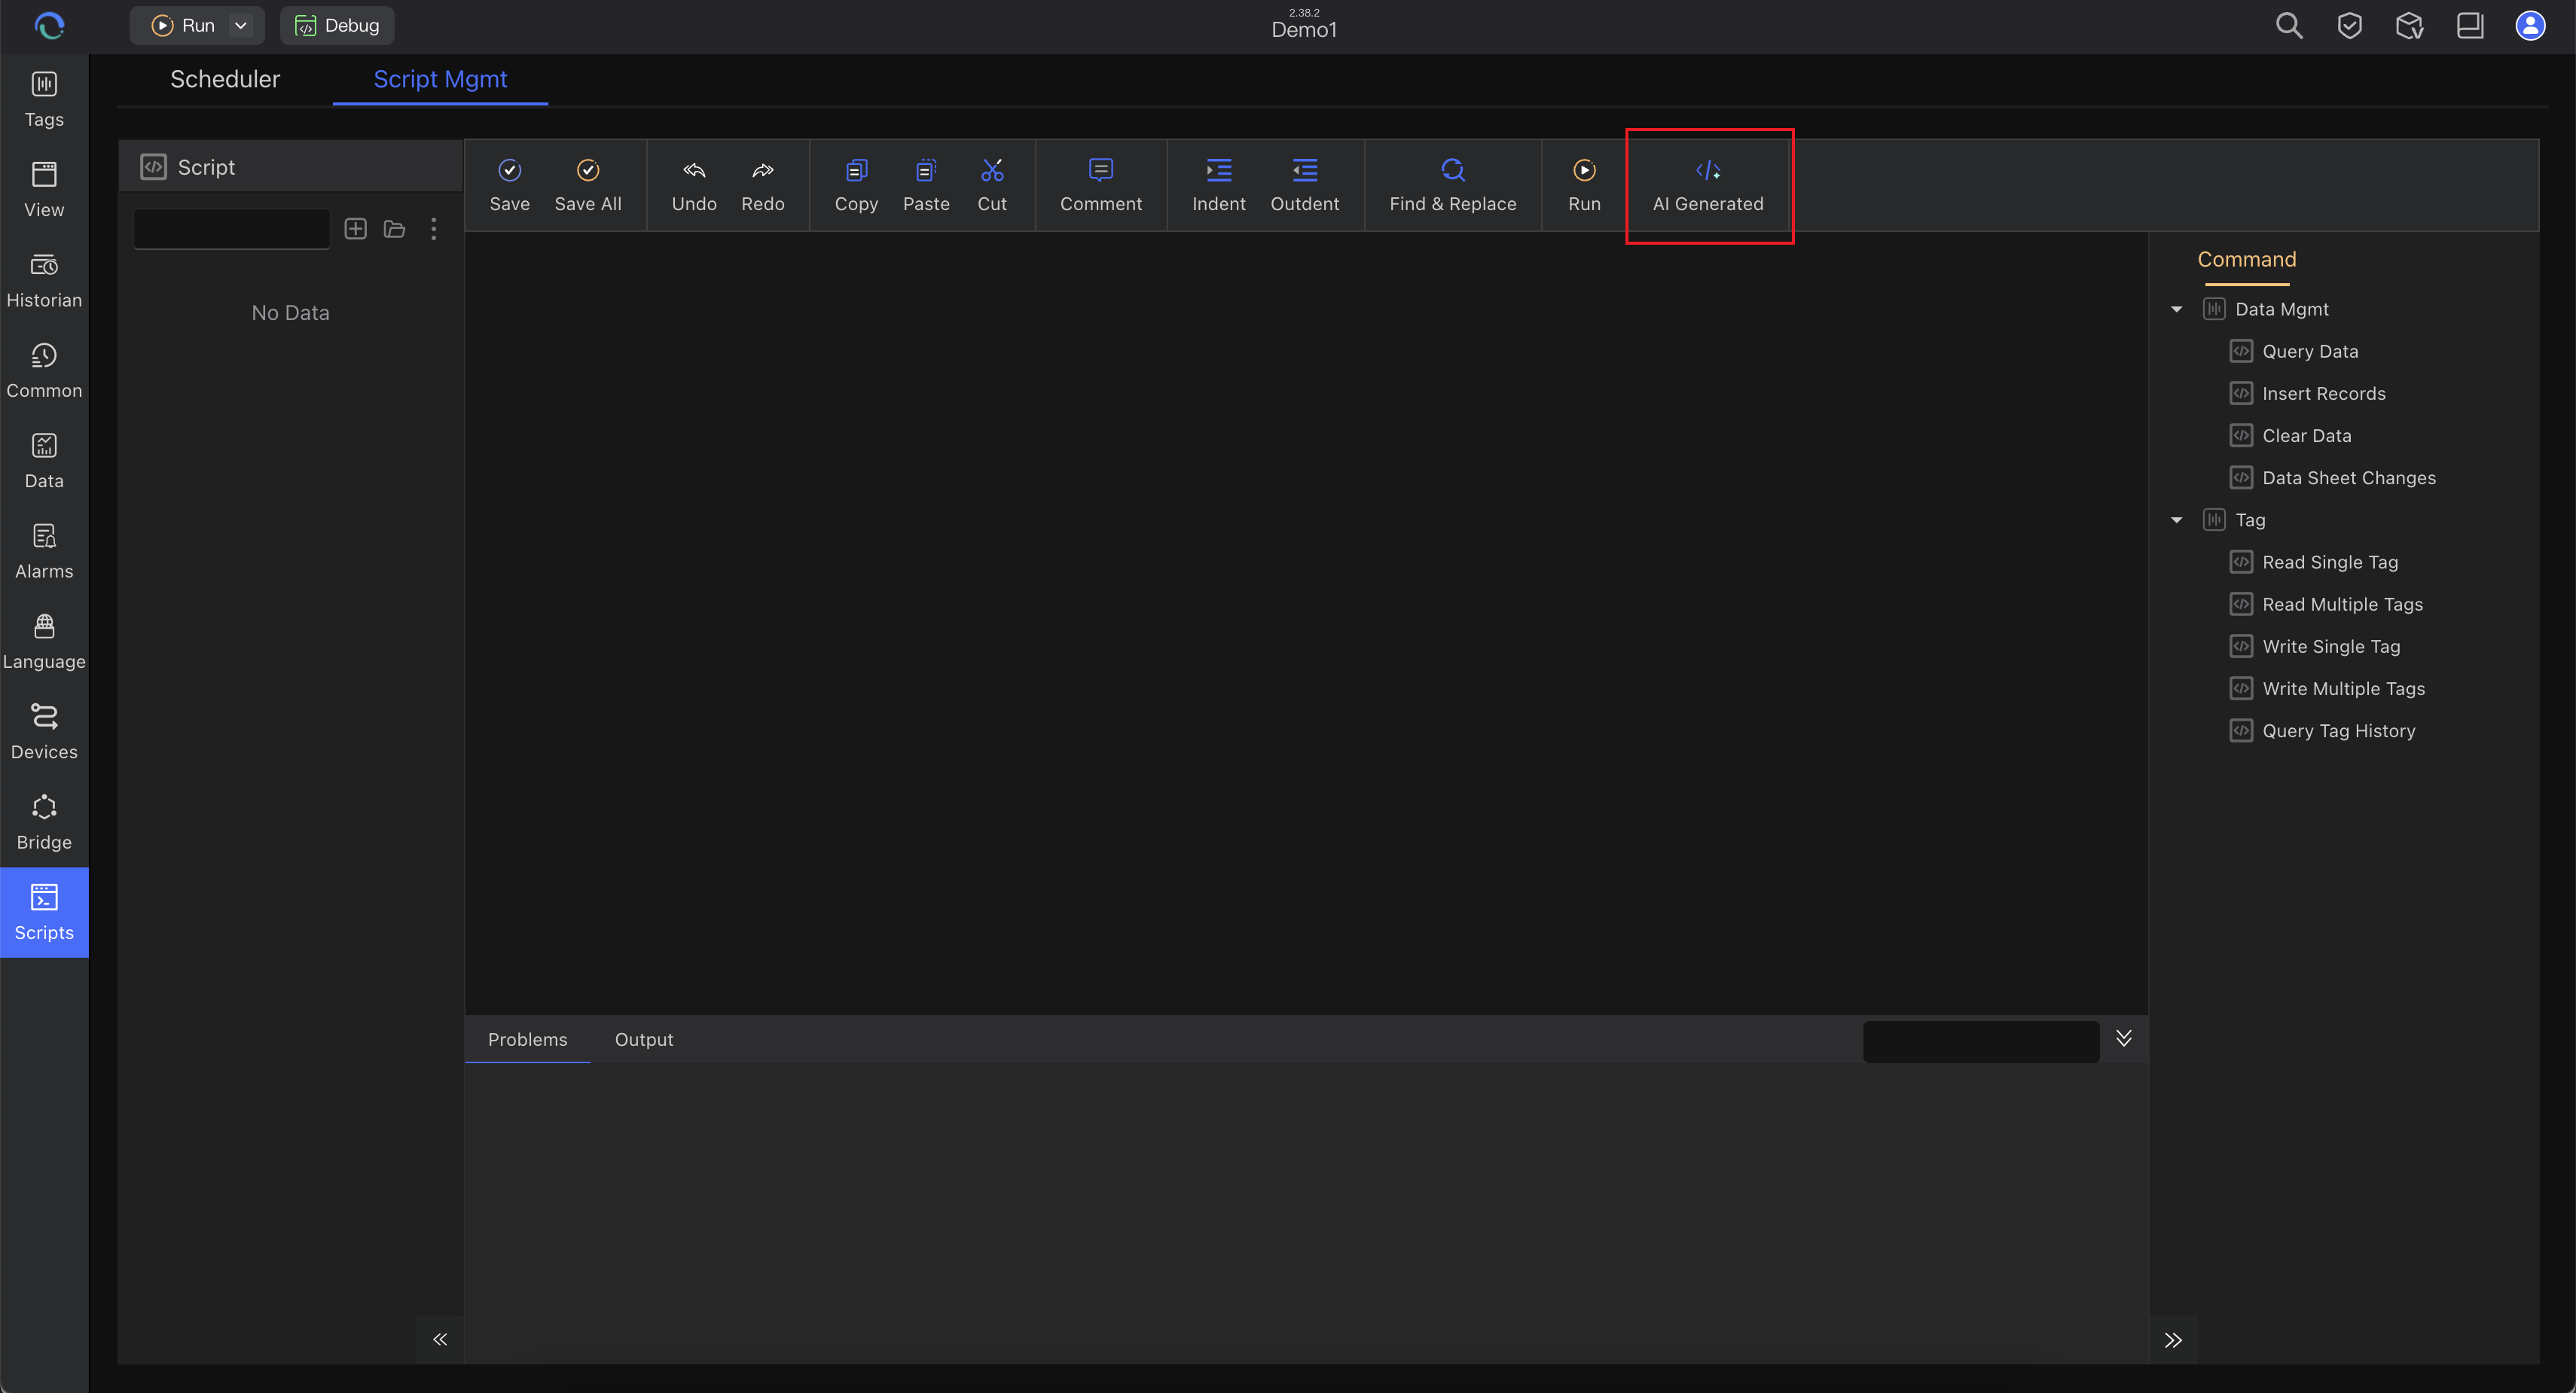
If you want to extend the project with automation logic, use the script workflow after the first view is already running.
How to Adapt This Workflow to Your Own Industry or Customer
The workflow stays the same across industries. Change the project inputs, not the overall method.
| Scenario | Start with | First project target |
|---|---|---|
| OEM machine builder | one machine, one controller, one tag list | overview page, setpoints, status, alarms |
| System integrator | one line area, one naming rule, one customer tag map | line page, alarm summary, historian baseline |
| Plant utility or process | one skid, tank, pump, or furnace | process values, running state, trend, alarm list |
| Factory dashboard | one KPI set and one area scope | overview dashboard with history and status |
For each customer project, define these before building:
- protocol and device communication method
- tag naming standard
- required screens
- operator actions
- alarm limits and categories
- whether history belongs in Historian or Data Management
Common Mistakes on the First Project
- Tags are configured but never tested: open Tag Manager → Start Debug before you judge the page
- The page looks good but shows no values: the layout exists, but tag binding is incomplete
- Runtime opens but values stay empty: check channel settings, service status, and tag addresses
- No hardware is available yet: start with internal tags unless you specifically need the external-channel structure
- A real PLC is connected but values are still simulated: check whether Static Simulation is still enabled on the channel
- Too much scope in the first screen: start with one small overview page, then expand
Next Step
After this page, you should be able to build a small project on your own.
The best next move is:
- refine your tag structure in Understanding Tags
- improve page layout in Understanding Views
- add history, alarms, and customer-specific logic as needed